Received: Wed 26, Nov 2025
Accepted: Wed 07, Jan 2026
Abstract
Objective: To evaluate whether digital therapy based on Rhythmic Auditory Stimulation (RAS) can more significantly improve the gait ability of stroke patients compared with single conventional motor rehabilitation training.
Methods: Sixty stroke patients with gait disorders during the rehabilitation period were screened and randomly assigned to the RAS intervention group (RG, n=30) and the control group (CG, n=30). CG received conventional rehabilitation treatment, while RG received additional RAS intervention on the basis of conventional rehabilitation. Both groups were treated for 4 weeks. Quantitative evaluations of outcome measures were conducted with the Fugl-Meyer Assessment for Lower Extremity (FMA-LE), Berg Balance Scale (BBS), and Functional Ambulation Category (FAC) at baseline before intervention, after intervention, and at 30-day, 60-day, and 90-day follow-ups. Statistical analysis was conducted using SPSS 26.0 software.
Results: At baseline, there were no statistically significant differences in demographic characteristics, clinical indicators, or scores of FMA-LE, BBS, and FAC between the two groups (all P>0.05). After intervention and at each follow-up time point, the above scores of both groups were significantly improved compared with baseline (all P<0.05), and the scores of RG at each time point were significantly higher than those of CG (all P<0.05). At the 90-day follow-up, the median (IQR) of FMA-LE score in RG was 24.00 (23.00, 27.00), and that in CG was 20.00 (18.00, 22.00) (Z=4.88, P<0.001); the median (IQR) of BBS score in RG was 47.00 (48.00, 48.75), and that in CG was 43.75 (45.50, 47.25) (Z=3.61, P<0.001); the median (IQR) of FAC grade in RG was 3.00 (4.00, 4.00), and that in CG was 2.00 (3.00, 3.00) (Z=4.76, P<0.001). During the study period, no adverse reactions occurred in either group. Two patients in RG withdrew (one due to stroke recurrence and one due to voluntary withdrawal), and the remaining 58 patients completed the entire trial.
Conclusion: RAS-assisted rehabilitation is superior to traditional therapy in enhancing balance and coordination, promoting lower limb function recovery, and improving gait ability, and the patient's rehabilitation cycle is significantly shortened.
Keywords
Stroke, Rhythmic Auditory Stimulation, Digital therapy, Gait dysfunction
1. Introduction
Stroke is an acute cerebrovascular disease with high morbidity, mortality, and disability rate, posing a major threat to the health of Chinese citizens [1, 2]. According to research, approximately 80% of stroke patients develop functional impairments, among which motor dysfunction is the most prominent symptom [3, 4]. Notably lower limb paralysis seriously impairs balance and gait function, increases the risk of falls, and impairs gait independence [5, 6]. Therefore, it is crucial to maximize neurofunctional recovery and accelerate gait rehabilitation through reasonable post-stroke rehabilitation.
Rehabilitation robots have been widely used in foreign studies. A clinical trial conducted by Miyagawa et al. [7] confirmed that wearable powered robots are expected to improve gait speed in post-stroke rehabilitation. However, conventional robotic rehabilitation approaches have certain limitations [8, 9]. Due to the shortage of rehabilitation therapists, as well as constraints such as time and economy, many patients cannot receive continuous, effective, and standardized rehabilitation training, nor can they make professional judgments and evaluations on their own rehabilitation status [10]. In recent years, emerging digital therapy has gradually become an advantageous tool to make up for these deficiencies. A variety of digital health interventions have been tested, such as the application of computers and mobile phones, rhythmic auditory stimulation for motor function training [11], and digital drug information management platforms [12].
Rhythmic Auditory Stimulation (RAS), as a type of music therapy, has attracted extensive attention from scholars at home and abroad and has been applied in the rehabilitation of lower limb dysfunction caused by neurological disorders [11]. Thaut MH et al. verified through a 24-week clinical trial [13] that RAS training significantly reduced the number of falls in Parkinson's disease patients and adjusted key gait parameters such as speed and step length. A meta-analysis by Magee WL et al. [14] indicated that music interventions may be beneficial for gait, upper limb function timing, communication outcomes, and quality of life after stroke. The 2016 Guidelines for Adult Stroke Rehabilitation and Recovery from the American Heart Association/American Stroke Association also indicated that RAS may be beneficial for improving patients' gait ability [15]. However, to our knowledge, the integration of RAS into digital therapy for post-stroke gait recovery has not been previously reported.
This study combines modern rehabilitation equipment with RAS for the rehabilitation of stroke patients with gait disorders. Meanwhile, intelligent devices in digital therapy are used to track patients' gait changes in the 10-Meter Walk Test (10MWT), record key indicators such as walking speed and step frequency in real time, and transmit rehabilitation information to patients and their families through a feedback system to adjust training plans in a timely manner. In addition, the study conducts quantitative analysis through a series of standardized assessment tools, including the Berg Balance Scale (BBS), Fugl-Meyer Assessment for Lower Extremity (FMA-LE), and Functional Ambulation Category (FAC), to comprehensively evaluate the improvement of patients' gait, balance ability, and motor function.
2. Methods
2.1. Design Overview
A prospective, single-center, parallel randomized controlled trial was designed in a clinical setting, including outcome measurements at baseline before intervention, after intervention, and at each follow-up node. After enrollment, patients were randomly divided into two groups: the RAS treatment group (RG) and the control group (CG). RG received 30 minutes of individual treatment per day for a total of 20 treatments (5 days a week for 4 weeks). CG received 30 minutes of conventional treatment training per day for 20 treatments (5 days a week for 4 weeks). Follow-up evaluations were conducted at 30 days, 60 days, and 90 days after the end of intervention. Researchers screened candidates for the study, and diagnoses and guidance were provided by experienced doctors from the Department of Neurology and Rehabilitation Medicine.
2.2. Participants
Stroke was diagnosed by MRI or CT imaging in accordance with current diagnostic criteria. Inclusion criteria were: first onset of stroke; clear symptoms of hemiplegia on one side; patients were able to take care of themselves before the onset; patients could walk independently for at least 10 meters with or without assistance; the time since the stroke onset exceeded 6 months; and informed consent was signed. Exclusion criteria were: resting heart rate <50 or >100 beats per minute; resting blood pressure <90/60 or >190/110 mm Hg; planned surgical treatment or endovascular treatment within the next 3 months; and receiving experimental drugs or instrument trials. After baseline assessment, eligible participants were randomly assigned and received the first treatment on the same day. The study was conducted in accordance with the general guidelines for clinical trials (Declaration of Helsinki), and the study protocol was formulated in accordance with the CONSORT principles. This study has been approved by the Ethics Review Committee of Shanxi Cardiovascular Hospital (XXGYY2022020).
2.3. Sample Size and Power
Sample size calculation was performed using PASS 2023 software. With α set at 0.05 (two-tailed test), power (1-β) at 0.8, and an intra-group standard deviation (SD = 3.2) derived from pilot study data, the minimum required sample size was calculated to be 26 cases per group. Considering the common attrition rate of 10%-15% in stroke rehabilitation studies, the sample size of each group was expanded to 30 cases in this study, resulting in a total sample size of 60 cases, to ensure that the final effective sample size meets the requirements of statistical testing.
Based on the actual effective sample sizes of 28 cases in the RG and 30 cases in the CG in this study, as well as the pilot study results, the statistical powers for the FMA-LE and BBS were calculated to be 0.89 and 0.86, respectively. For the FAC, the statistical power was estimated to be 0.83 through power analysis for ordinal categorical data (using the Generalized Estimating Equations [GEE] model). All results exceeded 0.80, indicating that the outcome measures were capable of effectively detecting clinically relevant differences between the RG and CG.
2.4. Randomization and Blinding
A random number table method was employed to randomly assign 60 eligible patients into two groups: 30 in the RG and 30 in the CG. First, a random sequence containing 60 unique numbers was generated according to the random number table. Subsequently, patients were assigned to the control group and the RAS intervention group based on the parity of the numbers: patients with odd numbers were assigned to the control group, and those with even numbers were assigned to the intervention group, ensuring 30 patients in each group. To ensure the accuracy and traceability of subsequent data analysis, the number of each patient was recorded in detail. Except for rehabilitation therapists and participants, personnel responsible for evaluation and statistical analysis were unaware of the grouping.
2.5. Intervention
In the specific implementation of rehabilitation training, patients in the CG received conventional medication therapy during the stroke rehabilitation period under the guidance of professional rehabilitation physicians, and performed rehabilitation training using three intelligent devices: the Lokomat Pro lower limb exoskeleton robot, the Xpace intelligent upper-lower limb cross training system, and the MRS-FS lower limb muscle group movement control system (Figure 1). The training time was fixed every day, with each session lasting 30 minutes, 5 times a week, for a continuous 4 weeks. On this basis, the RG further introduced the RAS training protocol, and all subjects in the RG adopted the same musical or auditory mode. The RG and CG maintained consistency in the length of the training cycle and the setting of training intensity, and all training activities were conducted under the full supervision and guidance of the same professionally qualified rehabilitation therapist.
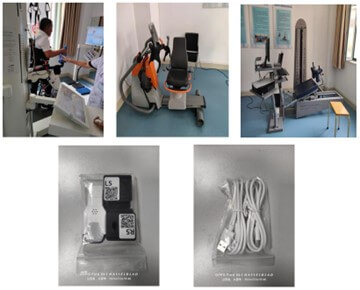
The equipments in the figure from left to right and top to bottom are respectively: LokomatPro Lower Limb Exoskeleton Robot, Xpace Intelligent Upper and Lower Limb Cross Training System, MRS-FS Lower Limb Muscle Group Movement Control System, and Digital Monitoring Equipment. LokomatPro focuses on gait reconstruction, Xpace is designed for early neural activation and bilateral coordination, and MRS-FS enhances lower limb motor control and muscle strength, which is applicable to patients in the recovery to sequelae stages. Digital monitoring devices are used to real-time track human physiological data during motor training and upload the data to the digital platform.
In this experiment, a total of 42 audio beats covering a frequency range of 20 to 140 BPM were designed. The beat type adopted square-wave pulse sounds (frequency: 1000 Hz, pulse width: 50 ms) without melody or harmony, so as to avoid the interference of musical style preferences on rehabilitation effects and ensure the standardization of stimulation. The 42 audio beats were divided into gradients of 5 beats per minute (BPM), covering a continuous frequency range of 20-140 BPM (e.g., 20, 25, 30...140 BPM) to meet the baseline step frequency needs of different patients. The initial frequency for each patient was based on the step frequency data measured in the 10-meter walk test conducted before rehabilitation. In addition, the beat intensity was uniformly set to 70-85 dB (A-weighted). To fully respect the patients' autonomy, they were allowed to adjust the volume according to their own comfort level and hearing status, so as to maximize their participation and comfort while ensuring the effectiveness and safety of RAS training. After the patients started RAS training, a progressive training strategy was adopted. In the first week, the rhythm of RAS was set based on the step frequency data measured in the 10-meter walk test before rehabilitation, and then the frequency of RAS was increased by 10% on a weekly basis compared with the previous week.
2.6. Outcomes and Follow-up
In this study, patients were systematically evaluated at baseline before intervention, after the end of intervention, and at 30-day, 60-day, and 90-day follow-ups. The evaluation of lower limb motor function mainly adopted the Fugl-Meyer Assessment for Lower Extremity (FMA-LE), using a 3-point scoring system: 0 points for inability to perform, 1 point for partial performance, and 2 points for complete performance. The total score ranges from 0 to 34 points, with higher scores indicating better motor function and rehabilitation status [16]. The evaluation of balance function was mainly based on the Berg Balance Scale (BBS), which divides balance function into 14 items from easy to difficult, each scored on a 5-level functional scale (0, 1, 2, 3, 4). The total score ranges from 0 to 56 points, with higher scores indicating better balance function [17]. Walking ability was evaluated using the Functional Ambulation Category (FAC), which is divided into 6 levels (0-5) according to the physical support required to maintain walking [18].
We also evaluated changes from baseline during treatment and follow-up. Rehabilitation therapists and relevant neurology experts conducted appropriate assessment, management, and classification of adverse events within 24 hours. Serious adverse events must be reported to the Safety Monitoring Committee within 24 hours of occurrence.
2.7. Statistical Analysis
Information was double-entered using Excel, and data analysis was performed using SPSS 26.0 software. All statistical tests were two-tailed, with P<0.05 considered statistically significant. Categorical data were presented as frequencies (n), and continuous data were described as mean ± standard deviation (SD). An independent samples t-test was used to compare two independent groups meeting the assumptions of normality and homogeneity of variance; the Wilcoxon rank-sum test was employed for between-group comparisons and within-group pre-intervention vs. post-intervention analyses.
2.8. Role of Funding Sources
The funders of this study had no role in study design, data collection, data analysis, data interpretation, or writing of the report. The corresponding author (Chen Chen) had full access to all data in the study and final responsibility for the decision to submit the manuscript for publication.
3. Results
3.1. Participant Flow
From December 2023 to November 2024, 84 patients were recruited at the Rehabilitation Center of Shanxi Cardiovascular Hospital. After 24 patients were excluded, 60 patients were enrolled in the study: 30 in RG and 30 in CG. Two patients in RG withdrew from the study (one due to stroke recurrence and one due to voluntary withdrawal). No adverse events were reported in either group during the study period (Figure 2). Table 1 shows the baseline demographic and clinical characteristics of the participants.
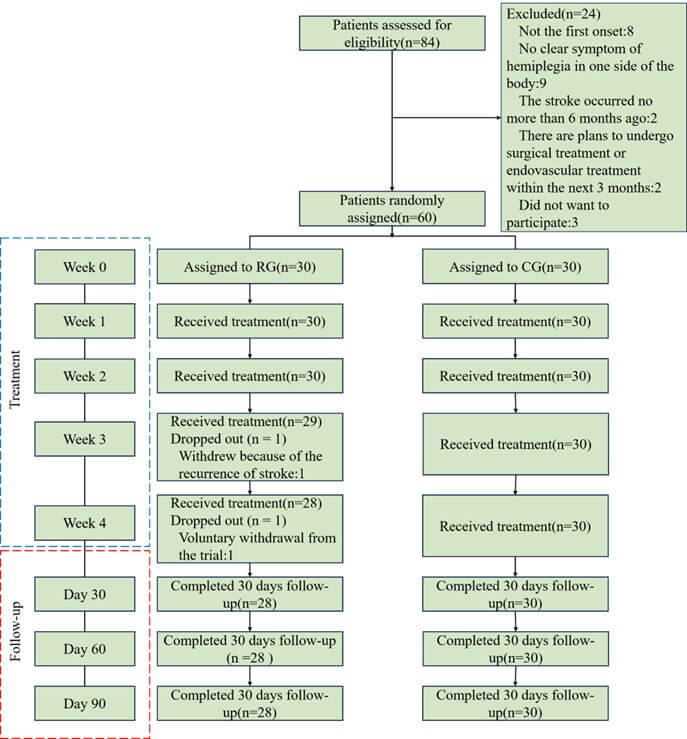
RG: RAS Intervention Group; CG: Control Group.
Table. 1. Baseline characteristics of the randomly assigned population.
|
Characteristic |
RG (N1=28) |
CG (N2=30) |
t
|
χ2 |
P Value |
|
Sex, n (%) |
|||||
|
Male |
19 (67.90) |
18 (60.00) |
0.39 |
0.53 |
|
|
Female |
9 (32.10) |
12 (40.00) |
|||
|
Age (years) |
64.27±7.35 |
63.86±7.87 |
0.05 |
0.96 |
|
|
Disease duration (days) |
57.57±9.55 |
52.77±10.20 |
0.46 |
0.65 |
|
|
Height (cm) |
168.52±6.12 |
167.88±5.53 |
0.15 |
0.88 |
|
|
Hemiplegia side, n (%) |
|||||
|
Left |
15 (53.60) |
17 (56.70) |
0.06 |
0.81 |
|
|
Right |
13 (46.40) |
13 (43.30) |
Supplement Figure 1 shows the pairwise comparison of FMA-LE scores between various time points in RG. Except for no statistically significant difference between 30-day and 60-day follow-up FMA-LE scores (Z=2.59, P>0.05), all other pairwise comparisons between time points showed statistically significant differences (Table 2). Supplement Figure 2 shows the pairwise comparison of FMA-LE scores between various time points in CG. Except for no statistically significant difference between baseline and 30-day follow-up FMA-LE scores (Z=2.45, P>0.05), the differences between other pairwise time points were statistically significant (Table 2). Supplement Figure 3 shows the comparison of FMA-LE scores between RG and CG at each time point. Except for no statistically significant difference between the two groups at baseline (Z=0.07, P>0.05), the differences between the two groups at other time points were statistically significant (Table 2).
Table. 2.
Comparison of FMA-LE results at different time points (baseline, 30-day follow-up,
60-day follow-up, 90-day follow-up).
|
RG (N1=28) |
CG (N2=30) |
Z |
P Value |
|
|
Baseline |
15.00 (14.00, 17.00) |
15.00 (13.00, 18.00) |
0.07 |
0.94 |
|
30-day follow-up |
19.00 (17.00, 21.75) |
17.00 (15.00, 19.00) |
2.52 |
0.01 |
|
60-day follow-up |
21.00 (19.00, 23.00) |
18.00 (16.00, 20.25) |
3.85 |
<0.001 |
|
90-day follow-up |
24.00 (23.00, 27.00) |
20.00 (18.00, 22.00) |
4.88 |
<0.001 |
|
Z1 |
3.05* |
2.45ns |
|
|
|
Z2 |
5.64**** |
5.20**** |
|
|
|
Z3 |
8.70**** |
8.35**** |
|
|
|
Z4 |
2.59ns |
2.75* |
|
|
|
Z5 |
5.64**** |
5.90**** |
|
|
|
Z6 |
3.05* |
3.15** |
|
|
Z1: Test statistic calculated for comparison between baseline and 30-day follow-up; Z2: Test statistic calculated for comparison between baseline and 60-day follow-up; Z3: Test statistic calculated for comparison between baseline and 90-day follow-up; Z4: Test statistic calculated for comparison between 60-day and 30-day follow-up; Z5: Test statistic calculated for comparison between 90-day and 30-day follow-up; Z6: Test statistic calculated for comparison between 90-day and 60-day follow-up; ns: P>0.05; *: P<0.05; **: P<0.01; ****: P<0.0001.
Supplement Figure 4 shows the pairwise comparison of BBS scores between various time points in RG. No statistically significant differences were found between 30-day follow-up and baseline (Z=2.59, P>0.05), 60-day and 30-day follow-up (Z=2.43, P>0.05), and 90-day and 60-day follow-up (Z=2.28, P>0.05). The differences between other pairwise time points were statistically significant (Table 3). Supplement Figure 5 shows the pairwise comparison of BBS scores between various time points in CG. No statistically significant differences were found between 30-day follow-up and baseline (Z=1.75, P>0.05), 60-day and 30-day follow-up (Z=2.35, P>0.05), and 90-day and 60-day follow-up (Z=2.45, P>0.05). The differences between other pairwise time points were statistically significant (Table 3). Supplement Figure 6 shows the comparison of BBS scores between RG and CG at each time point. Except for no statistically significant difference between the two groups at baseline (Z=0.37, P>0.05), the differences between the two groups at other time points were statistically significant (Table 3).
Table. 3. Comparison of BBS results at different time points (baseline, 30-day follow-up,
60-day follow-up, 90-day follow-up).
|
RG (N1=28) |
CG (N2=30) |
Z |
P
Value |
|
|
Baseline |
43.00(41.00,45.00) |
43.00(41.00,46.00) |
0.37 |
0.71 |
|
30-day follow-up |
46.00(45.00,47.00) |
44.00(41.00,46.25) |
2.62 |
0.01 |
|
60-day follow-up |
46.00(46.50,48.00) |
43.00(44.50,47.00) |
2.78 |
0.01 |
|
90-day follow-up |
47.00(48.00,48.75) |
43.75(45.50,47.25) |
3.61 |
<0.001 |
|
Z1 |
2.59ns |
1.75ns |
|
|
|
Z2 |
5.02**** |
4.10*** |
|
|
|
Z3 |
7.30**** |
6.55**** |
|
|
|
Z4 |
2.43ns |
2.35ns |
|
|
|
Z5 |
4.71**** |
4.80**** |
|
|
|
Z6 |
2.28ns |
2.45ns |
|
|
Z1: Test statistic calculated for comparison between baseline and 30-day follow-up; Z2: Test statistic calculated for comparison between baseline and 60-day follow-up; Z3: Test statistic calculated for comparison between baseline and 90-day follow-up; Z4: Test statistic calculated for comparison between 60-day and 30-day follow-up; Z5: Test statistic calculated for comparison between 90-day and 30-day follow-up; Z6: Test statistic calculated for comparison between 90-day and 60-day follow-up; ns: P>0.05; ***: P<0.001; ****: P<0.0001.
Supplement Figure 7 shows the pairwise comparison of FAC grades between various time points in RG. No statistically significant differences were found between 60-day and 30-day follow-up (Z=1.45, P>0.05), and 90-day and 60-day follow-up. The differences between other pairwise time points were statistically significant (Table 4). Supplement Figure 8 shows the pairwise comparison of FAC grades between various time points in RG. No statistically significant differences were found between 60-day and 30-day follow-up (Z=1.23, P>0.05), 90-day and 30-day follow-up (Z=2.26, P>0.05), and 90-day and 60-day follow-up (Z=1.03, P>0.05). The differences between other pairwise time points were statistically significant (Table 4). Supplement Figure 9 shows the comparison of BBS scores between RG and CG at each time point. Except for no statistically significant difference between the two groups at baseline (Z=0.04, P>0.05), the differences between the two groups at other time points were statistically significant (Table 4).
Table. 3. Comparison of BBS results at different time points (baseline, 30-day follow-up,
60-day follow-up, 90-day follow-up).
|
RG (N1=28) |
CG (N2=30) |
Z |
P
Value |
|
|
Baseline |
43.00(41.00,45.00) |
43.00(41.00,46.00) |
0.37 |
0.71 |
|
30-day follow-up |
46.00(45.00,47.00) |
44.00(41.00,46.25) |
2.62 |
0.01 |
|
60-day follow-up |
46.00(46.50,48.00) |
43.00(44.50,47.00) |
2.78 |
0.01 |
|
90-day follow-up |
47.00(48.00,48.75) |
43.75(45.50,47.25) |
3.61 |
<0.001 |
|
Z1 |
2.59ns |
1.75ns |
|
|
|
Z2 |
5.02**** |
4.10*** |
|
|
|
Z3 |
7.30**** |
6.55**** |
|
|
|
Z4 |
2.43ns |
2.35ns |
|
|
|
Z5 |
4.71**** |
4.80**** |
|
|
|
Z6 |
2.28ns |
2.45ns |
|
|
Z1: Test statistic calculated for comparison between baseline and 30-day follow-up; Z2: Test statistic calculated for comparison between baseline and 60-day follow-up; Z3: Test statistic calculated for comparison between baseline and 90-day follow-up; Z4: Test statistic calculated for comparison between 60-day and 30-day follow-up; Z5: Test statistic calculated for comparison between 90-day and 30-day follow-up; Z6: Test statistic calculated for comparison between 90-day and 60-day follow-up; ns: P>0.05; ***: P<0.001; ****: P<0.0001.
4. Discussion
This study is the first to embed Rhythmic Auditory Stimulation (RAS) into post-stroke lower limb robotic training in the form of "digital therapy" and conduct continuous tracking for 90 days after 4 weeks of intervention. The main findings can be summarized as three points: the RAS intervention group (RG) demonstrated significant superiority over the control group (CG) across all outcome measures, including walking speed, step frequency, FMA-LE, BBS, and FAC scores; at the 90-day follow-up, the net gain of FMA-LE in RG was 9 points, the net gain of BBS was 4 points, and the FAC increased by 1 grade, all higher than those reported in current studies on robot-only or RAS-only; the adverse event rate was not different between the two groups, indicating that digital RAS can amplify rehabilitation benefits without increasing risks.
At present, the implementation of traditional RAS mostly relies on metronomes or CD players, which cannot dynamically adjust according to gait errors [19, 20]. In this study, 42 types of audio beats were real-time matched with 10MWT data to form "closed-loop" stimulation; patients could independently adjust the volume through a mobile App, and family members could synchronously receive walking speed curves, realizing transparent information between "hospital and family". At the 90-day follow-up, the decline in walking speed from post-intervention to the 90-day follow-up was significantly smaller in RG (0.08 m/s) than in CG (0.19 m/s), suggesting that digital compliance management may delay natural decline.
A meta-analysis by Zhang et al. [21] showed that robot-only training had a net gain of 4.10 points in FMA-LE (95% CI: 2.90-5.30), and RAS-only had a net gain of 3.30 points; the net gain in RG in this study was 9.00 points, with a combined effect size of Cohen’s d=1.24, which is a large effect.
This study still has certain limitations. First, this was a single-center study. Despite the use of randomization and parallel controls, the sample population was restricted to patients from Shanxi Cardiovascular Hospital, leading to potential geographical and ethnic biases. Future multi-center studies are needed to validate these findings; Subsequently, evaluator blinding was achieved, but therapists and patients could not be blinded, which may lead to expectation bias; in the future, "sham-RAS" (non-rhythmic white noise) can be tried as a control [22]; What’s more, Mechanistic endpoints were not assessed. This study only collected behavioral outcomes and did not acquire electroencephalography (EEG), brain imaging, or serum brain-derived neurotrophic factor (BDNF) data; Ultimately, patients in the hyperacute phase have greater potential for neural circuit remodeling and may exhibit a more significant synergistic repair effect in response to the rhythmic stimulation of RAS theoretically [15]. On the other hand, however, patients at this stage have poorer balance function and a higher risk of falls. The dynamic frequency adjustment of RAS may increase challenges to gait coordination, and the interactions between concurrent medications (such as antiplatelet and antihypertensive drugs) and the intervention remain unclear. Future studies should conduct specialized clinical trials targeting patients with onset < 6 months, with a focus on monitoring disease stability and intervention safety, to verify the applicability and optimization pathway of this digital therapy in the hyperacute phase.
Future rehabilitation studies on post-stroke walking disorders can be extended to other rhythmic stimulations, such as combining transcutaneous auricular vagus nerve stimulation (taVNS) with RAS to observe whether it can further enhance the activity of the vagus-dopaminergic pathway and form a complete medical system with digital healthcare.
5. Conclusion
Integrating rhythmic auditory stimulation (RAS) into robotic gait training via a digital closed-loop approach significantly improves motor, balance, and gait functions in patients with chronic post-stroke lower limb dysfunction. This intervention is safe, clinically applicable, and scalable, providing new evidence-based support and productization pathways for digital stroke rehabilitation.
Ethics Approval and Consent to Participate
We certify that the study was performed in accordance with the 1964 declaration of HELSINKI and later amendments. This study protocol was reviewed and approved by [the Ethics Committee of Shanxi Cardiovascular Hospital], approval number [XXGYY2022020]. Written informed consent was obtained from all the participants prior to the enrollment of this study.
Consent for Publication
Consent for publication was obtained from the participants.
Availability of Data and Material
The datasets generated/analysed during the current study are available.
Conflict of Interest
The authors declare that the research was conducted in the absence of any commercial or financial relationships that could be construed as a potential conflict of interest.
Author Contributions
Zongxuan Li: Writing - Original Draft, Data Curation, Software. Ling Ding: Writing - Review & Editing, Methodology, Investigation, Conceptualization. Chen Chen: Writing - Review & Editing, Formal Analysis, Visualization. Hong Liu: Writing - Review & Editing, Methodology, Resources, Validation. Ziwei Hou: Writing - Review & Editing, Project Administration, Supervision. Yunpeng Wang: Writing - Review & Editing, Conceptualization.
Funding
Four Batches " innovation Project of invigorating Medical through Science a Technology of Shanxi Province(2022XM07); Shanxi Province Chinese Medicine Science and Technology special research project (2024ZYY2A023);The Integration of Medicine, Engineering, and Basic Medical Sciences Special Project of Shanxi Provincial Health Commission (2025YGYL026).
Acknowledgments
We confirm that the manuscript is our original work and has not been published previously, nor is it currently under consideration for publication elsewhere. All data presented in this manuscript are accurate and have been obtained through legitimate research methods. We declare that there are no conflicts of interest regarding the publication of this article. All authors have contributed significantly to the research and have read and approved the final version of the manuscript.
REFERENCES
[1] Idha Sood, Ranjit J
Injety, Amtul Farheen, et al. “Quantitative electroencephalography to assess
post-stroke functional disability: A systematic review and meta-analysis.” J
Stroke Cerebrovasc Dis, vol. 33, no. 12, pp. 108032, 2024. View at: Publisher
Site | PubMed
[2] Vivian Fu, Stephanie
Thompson, Nicola Kayes, et al. “Supporting Long-Term Meaningful Outcomes in
Stroke Rehabilitation.” Curr Neurol Neurosci Rep, vol. 25, no. 1, pp.
17, 2025. View at: Publisher
Site | PubMed
[3] Hui-Xian Yu, Zhao-Xia
Wang, Chang-Bin Liu, et al. “Effect of Cognitive Function on Balance and
Posture Control after Stroke.” Neural Plast, vol. 2021, pp. 6636999, 2021. View at: Publisher Site | PubMed
[4] Yoshitaka Kato, Shin
Kitamura, Masaki Katoh, et al. “Stroke patients with nearly independent
transfer ability are at high risk of falling.” J Stroke Cerebrovasc Dis,
vol. 31, no. 1, pp. 106169-106176, 2022. View at: Publisher
Site | PubMed
[5] Sora Ohnishi, Naomichi
Mizuta, Naruhito Hasui, et al. “Effects of transcranial direct current
stimulation of bilateral supplementary motor area on the lower limb motor
function in a stroke patient with severe motor paralysis: a case study.” Brain
Sci, vol. 12, no. 4, pp. 452-463, 2022. View at: Publisher Site | PubMed
[6] Naomichi Mizuta, Naruhito
Hasui, Takumi Kai, et al. “Characteristics of limb kinematics in the gait
disorders of post-stroke patients.” Sci Rep, vol. 14, no. 1, pp.
3082-3091, 2024. View at: Publisher
Site | PubMed
[7] Daichi
Miyagawa, Akira Matsushima, Yoichi Maruyama, et al. “Gait training with a
wearable powered robot during stroke rehabilitation: a randomized
parallel-group trial.” J Neuroeng Rehabil, vol. 20, no. 1, pp. 54, 2023.
View at: Publisher Site | PubMed
[8] Yong-Hwa Park, Dae-Hwan
Lee, Jung-Ho Lee “A Comprehensive Review: Robot-Assisted Treatments for Gait
Rehabilitation in Stroke Patients.” Medicina (Kaunas), vol. 60, no. 4,
pp. 620, 2024. View at: Publisher
Site | PubMed
[9] Rocco S Calabrò, Gregorio
Sorrentino, Anna Cassio, et al. “Robotic-assisted gait rehabilitation following
stroke: a systematic review of current guidelines and practical clinical
recommendations.” Eur J Phys Rehabil Med, vol 57, no. 3, pp. 460-471,
2021. View at: Publisher
Site | PubMed
[10] Raouf Fareh, Ammar Elsabe,
Mohammed Baziyad, et al. “Will Your Next Therapist Be a Robot?-A Review of the
Advancements in Robotic Upper Extremity Rehabilitation.” Sensors (Basel),
vol. 23, no. 11, pp. 5054, 2023. View at: Publisher Site | PubMed
[11] Sofia Scataglini, Cas Van
Bocxlaer, Lynn Jansen, et al. “Influence of wearable rhythmic auditory
stimulation on Parkinson's disease, multiple sclerosis, and stroke: a
systematic review and meta-analysis.” Sci Rep, vol. 15, no. 1, pp.
21432, 2025. View at: Publisher
Site | PubMed
[12] Tara Purvis, Catherine
Burns, Seamus Barker, et al. “Co-Designing a Digital Stroke Prevention
Platform: Leveraging Lived Experience and Expert Advice.” Health Expect,
vol. 28, no. 3, pp. e70293, 2025. View at: Publisher Site | PubMed
[13] Michael
H Thaut 1, Ruth R Rice 2, Thenille Braun Janzen, et al. “Rhythmic auditory
stimulation for reduction of falls in Parkinson's disease: a randomized
controlled study.” Clin Rehabil, vol. 33, no. 1, pp. 34-43, 2019. View
at: Publisher Site | PubMed
[14] Wendy
L Magee, Imogen Clark, Jeanette Tamplin, et al. “Music interventions for
acquired brain injury.” Cochrane Database Syst Rev, vol. 1, no. 1, pp. CD006787,
2017. View at: Publisher Site | PubMed
[15] Carolee J Winstein, Joel
Stein, Ross Arena, et al. “Guidelines for Adult Stroke Rehabilitation and
Recovery: A Guideline for Healthcare Professionals From the American Heart
Association/American Stroke.” Stroke, vol. 47, no. 6, pp. e98-e169,
2016. View at: Publisher
Site | PubMed
[16] Yun-Ting Xiang, Jia-Jia
Wu, Jie Ma, et al. “Peripheral nerve transfers for dysfunctions in central
nervous system injuries: a systematic review.” Int J Surg, vol. 110, no.
6, pp. 3814-3826, 2024. View at: Publisher Site | PubMed
[17] Kyung Lim Joa “Outcome
Measurement in Balance Problems: Berg Balance Scale.” Ann Rehabil Med,
vol. 48, no. 2, pp. 103-104, 2024. View at: Publisher Site | PubMed
[18] Tamaya Van Criekinge,
Charlotte Heremans, Jane Burridge, et al. “Standardized measurement of balance
and mobility post-stroke: Consensus-based core recommendations from the third
Stroke Recovery and Rehabilitation Roundtable.” Int J Stroke, vol. 38,
no. 1, pp. 41-51, 2024. View at: Publisher Site | PubMed
[19] Li-Ann Leow, Sarah Watson,
David Prete, et al. “How groove in music affects gait.” Exp Brain Res,
vol. 239, no. 8, pp. 2419-2433, 2021. View at: Publisher Site | PubMed
[20] Brittany S Roberts, Emily
A Ready, Jessica A Grahn “Musical enjoyment does not enhance walking speed in
healthy adults during music-based auditory cueing.” Gait Posture, vol.
89, pp. 132-138, 2021. View at: Publisher Site | PubMed
[21] Bohan Zhang, Ka Po Wong,
Ruifu Kang, et al. “Efficacy of Robot-Assisted and Virtual Reality
Interventions on Balance, Gait, and Daily Function in Patients With Stroke: A
Systematic Review and Network Meta-analysis.” Arch Phys Med Rehabil,
vol. 104, no. 10, pp. 1711-1719, 2023. View at: Publisher Site | PubMed
[22] Eryn D Gerber, Camilo Giraldo, Brett Whorley, et al. “Subthreshold white noise vibration alters trembling sway in older adults.” Hum Mov Sci, vol. 90, pp. 103119, 2023. View at: Publisher Site | PubMed