Received: Thu 17, Oct 2024
Accepted: Tue 12, Nov 2024
Abstract
Purpose: To examine the agreement between end-tidal carbon dioxide (EtCO2) and partial pressure of carbon dioxide (PaCO2) in young children during two-lung ventilation (TLV) and one-lung ventilation (OLV).
Methods: 172 patients aged <2 years who underwent thoracoscopic surgery between 6 May, 2022, and 31 August, 2023 were analyzed. The tidal volume was 8 mL/kg during TLV and 6 mL/kg during OLV with 5 cm H2O positive end-expiratory pressure throughout the procedure. The main outcome of PaCO2-EtCO2 agreement was defined as PaCO2 within 5 mmHg of its paired EtCO2, which was determined using Bland-Altman analysis.
Results: We analyzed the paired PaCO2-EtCO2 data of 73 girls and 99 boys (median [range interquartile] age, 6.0 [5 to 8.9] months). Eight points (4.66%) were outside the 95% CI of LoA. The 95% CI of LoA was within the maximum allowable difference (-5 to 5). Therefore, EtCO2 can replace PaCO2 during TLV. During OLV, 72.09% had EtCO2 within 5 mmHg of their paired PaCO2. Patients with arterial oxygen partial pressure (PaO2)/fraction of inspired oxygen (FIO2) (P/F) ratios of <200 mmHg had a lower agreement than those with ratios of ≥200 mmHg (55.88% vs. 81.37%, P=0.0001). The 95% CI of LoA was outside the maximum allowable difference (-5 to 5). Therefore, EtCO2 cannot replace PaCO2 during OLV.
Conclusion: The PaCO2-EtCO2 agreement was low during OLV, especially for patients with P/F ratios of <200 mmHg. Low tidal volume ventilation was possible risk factor associated with disagreement.
Keywords
End-tidal carbon dioxide, partial pressure of carbon dioxide in artery, Bland-Altman regression, one-lung ventilation
1. Introduction
Thoracoscopic surgery requires establishing an artificial carbon dioxide (CO2) pneumothorax. However, young children may develop severe hypercapnia during one-lung ventilation (OLV) [1]. Severe hypercapnia inhibits cerebral blood flow autoregulation [2], induces cerebral edema [3] and spasms, and suppresses cortical activity [4]. Therefore, the intraoperative partial pressure of carbon dioxide in arteries (PaCO2) is closely monitored for effective management. The PaCO2 measured via blood gas analysis is accurate and reliable; however, it requires invasive puncture and cannot be measured continuously. Capnography is a non-invasive method that enables continuous measurement of the end-tidal carbon dioxide (EtCO2). It offers a cost-effective and less complicated alternative to arterial cannulation and is widely utilized in pediatric clinical practice as a substitute for measuring the PaCO2 [5-7]. The EtCO2 measured through capnography is based on the combination of alveolar gas, which is relatively rich in CO2, and gas in ventilated lung regions with poor perfusion (known as dead space) with low concentrations of CO2.
The dead space refers to the components of the ventilated respiratory system that do not contribute to gas exchange, as well as to the alveoli that undergo ventilation but are not adequately perfused owing to physiological or pathological factors. This includes the airways and breathing apparatus. Physiological, anatomical, and pathological factors can lead to differences in the PaCO2 and EtCO2. A mean difference of 0-5 mmHg between the PaCO2 and EtCO2 is commonly considered indicative of good agreement. This level of agreement has been observed in patients under general anesthesia [8, 9]. However, the EtCO2 has not been examined as a substitute for the PaCO2 in children undergoing OLV. Hence, factors that inhibit ventilation/perfusion (V̇/Q̇) matching during OLV in young children should be evaluated [10]. This study aimed to assess the validity of the EtCO2 as an indicator of the PaCO2 in young children undergoing OLV and to identify the risk factors associated with the discrepancy between the PaCO2 and EtCO2.
2. Materials and Methods
In this study, we conducted a secondary analysis of two prospective cohort studies [11, 12] to examine the agreement between the PaCO2 and EtCO2 during two-lung ventilation (TLV) and OLV. The requirement for informed consent was waived by the Shanghai Children’s Hospital Review Board because this study involved a secondary data analysis. The rights of the participants were also not infringed upon, and we ensured their welfare, as the study posed a minimal risk.
2.1. Study Participants and Setting
Shanghai Children’s Hospital is one of the two hospitals with the largest number of congenital pulmonary airway malformation (CPAM) cases in China and admits almost 180 pediatric patients with CPAM annually. The study involved patients aged <2 years who had CPAM and were admitted to the Department of Cardiothoracic Surgery at Shanghai Children’s Hospital between 6 May, 2022, and 31 August, 2023. All children enrolled in this study had participated in our previous studies; thus, a protocolized surgical and anesthetic pathway was followed for their video-assisted thoracoscopic lung resection.
The standardized general anesthetic protocol used for all children included pre-oxygenation and intravenous sufentanil (1-2 µg kg-1), propofol (2-3 mg kg-1), and rocuronium (0.6 mg kg-1) or cis-atracurium 0.1-0.2 mg-1 kg-1 h. A 5-F bronchial blocker was placed outside the endotracheal tube and into the target bronchi using a fiberoptic bronchoscope (2.8-mm diameter, OLYMPUS BF TYPE XP60). The tracheal intubation cuff pressure was maintained at 20-25 cmH2O. Surgeons defined the quality of the lung isolation as good, moderate, and poor [13].
At the end of OLV, the lungs were re-expanded manually using sustained inflation with a positive end-expiratory pressure (PEEP) of 30-35 cmH2O for 10-15 s under direct observation to restore TLV [11, 12, 14]. Anesthesia was maintained with sevoflurane (1.5-2.0 vol%) with continuous infusion of sufentanil 1-2 µg kg-1 h-1, rocuronium (0.6 mg kg-1 h-1), or cis-atracurium (0.1 mg-1 kg-1 h). Mechanical ventilation was controlled in pressure-controlled ventilation-volume guaranteed mode. The circle circuit was utilized with a heat and moisture exchanger installed at both the inlet and outlet of the anesthesia machine. All patients received ventilation using the same type of mechanical ventilator (Datex-Ohmeda-Avance CS2 Anesthesia Machine, GE Healthcare, Madison, WI, USA) and the same type of screw tube. The tidal volume was 8 mL/kg during TLV and 6 mL/kg during OLV. The inspiration to expiration ratio (I: E) was 1:2 throughout the procedure. The inspired oxygen fraction was 0.5 during TLV and 1 during OLV. The inspiratory/ expiratory (I/E) ratio was 1:2 through the procedure with the peak airway pressure maintaining below 30 cmH2O. Viral filter and HME were not used in the circuit. Mainstream measurements were undertaken in all the children.
Crystalloid solutions (6-10 ml kg-1 h-1) were used as maintenance fluids intraoperatively. The artificial pneumothorax pressure was maintained at 5-7 cmH2O. All lung resections were performed under video-assisted thoracoscopy. The study involved two arterial blood gas analyses at 5-10 min after tracheal intubation (T1) and 20-30 min after OLV commencement (T2). At the same time, mean airway pressure, static dynamic compliance, PEEP, tidal volume, RR, I:E, end-tidal carbon pressure, pulse oxygen saturation, and hemodynamics including invasive blood pressure and heart rate were recorded at T1 and T2. All children were decubitus for the surgery. At T2, the surgery had already started.
2.2. Data Collection
Data on the demographic characteristics, surgical procedures performed, PaCO2, EtCO2, invasive blood pressure, arterial oxygen partial pressure (PaO2)/fraction of inspired oxygen (FIO2) ratio, and mechanical ventilation parameters were collected from the electronic health records by CEZ and RW.
2.3. EtCO2 and PaCO2 Concentrations
A carbon dioxide analyzer (D-Fend Pro, M1182629, GE Healthcare) calibrated before sampling was used to measure the EtCO2 concentrations. An ABL800 blood gas analyzer was used to measure the PaCO2. Radial artery blood was collected 5-10 min after TLV and 20-30 min after commencing OLV, and the EtCO2 was simultaneously recorded. All patients had invasive blood pressure in the radial artery.
2.4. Pairing of EtCO2 and PaCO2 Data and Systolic Blood Pressure Data
The paired EtCO2 and systolic blood pressure were recorded during OLV after the arterial blood gas measurement.
2.5. Definition of PaCO2-EtCO2 Agreement
The PaCO2 is generally 2-5 mmHg higher than the EtCO2 under physiologically stable conditions [15]. Therefore, the PaCO2 and EtCO2 were considered in agreement if their difference was within 5 mmHg.
2.6. Dead Space
The dead-space fraction was calculated as PaCO2-EtCO2/PaCO2 [15].
2.7. Statistical Analyses
The agreement between the PaCO2 and EtCO2 was assessed for the entire study population. First, to assess the degree of difference in agreement that was specifically related to OLV, Bland-Altman plots [16] were created for the baseline data during TLV (T1) and during OLV (T2). Second, Bland-Altman plots were created to visually compare the trends in agreement across different PaO2/FiO2 ratio groups. Finally, we evaluated the constant and proportional differences between the PaCO2 and EtCO2 for each pair and estimated the Pearson correlation coefficients using Passing-Bablok and Deming regressions [16-18]. Data are expressed as the n (%), mean ± standard deviation, or median (interquartile range, IQR) depending on the data distribution. All statistical calculations were performed using SPSS version 26 (Statistical Package for the Social Sciences; IBM, Armonk, NY). Bland-Altman, Passing-Bablok, and Deming regressions were calculated using MedCalc® Statistical Software version 19.6.4 (MedCalc Software Ltd, Ostend, Belgium; https://www.medcalc.org; 2021). All P-values were two-sided, and P<0.05 denoted statistical significance.
3. Results
In total, 172 young children (73 girls and 99 boys; median [range interquartile] age, 6.0 [5 to 8.9] months) met the inclusion criteria. 82 were right lung surgeries undertaken and 90 were left lung. Surgeons defined the quality of the lung isolation as good for all patients. The final analytic cohort contributed 172 paired PaCO2-EtCO2 data points (Table 1).
Table. 1. Characteristics of the 172 young children undergoing one-lung
ventilation.
|
Characteristics |
Pairs in agreement (n=124) |
Pairs not in agreement (n=48) |
Z/t orc2 |
P-value
|
|
Sex (male/female) |
71/53 |
28/20 |
0.016 |
0.898 |
|
Age (month, M [P25, P75]) |
6.76 [5.08, 9.665] |
5.02 [3.96, 6.36] |
-4.6 |
0.000 |
|
Hb |
113.39±8.97 |
115.28±9.19 |
1.218 |
0.225 |
|
low tidal volume |
64 |
34 |
5.22 |
0.022 |
|
Laterality (left/right) |
62/62 |
28/20 |
0.963 |
0.326 |
|
Tidal volume at T1 (ml/kg) |
8 |
8 |
/ |
/ |
|
RR at T1 (min-1) |
20 |
20 |
/ |
/ |
|
I:E at T1 |
1:2 |
1:2 |
/ |
/ |
|
Tidal volume at T2 (ml/kg) |
6 |
6 |
/ |
/ |
|
RR at T2 (min-1) |
25 |
25 |
/ |
/ |
|
I:E at T2 |
1:2 |
1:2 |
/ |
/ |
|
Pmean at T2 (cmH2O) |
11.04±1.64 |
11.73±2.59 |
2.08 |
0.039 |
|
Hypotension status at T2 |
37 |
13 |
0.127 |
0.721 |
Hb:
Hemoglobin; positive end expiratory pressure;
RR: Respiratory Rate.
àT1: 5 min after two-lung ventilation; T2: 20 min after one-lung ventilation.
EtCO2: End-tidal carbon dioxide; PaCO2: Partial pressure of carbon dioxide.
3.1. Bland-Altman Regression
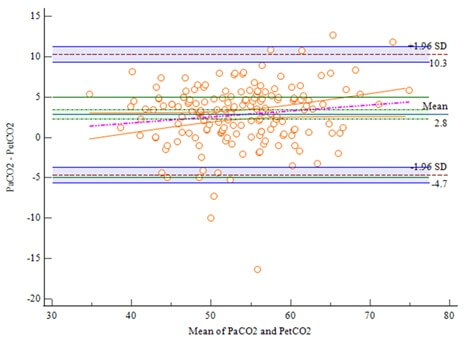
The analysis of the 172 paired PaCO2-EtCO2 data during TLV is shown in (Figure 1). The limits of agreement (LoA) were -4.34 to 4.39, with 95% CI of -4.91 to 4.96. Eight points (4.66%) were outside the 95% CI of LoA. All other points were randomly distributed above and below the average difference level and within the LoA. The 95% CI of LoA was within the maximum allowable difference (-5 to 5). The Bland-Altman regression equation was y=1.7029-0.04502x. The 95% CI of the overall intercept and slope of the equation all included 0, and the P value was greater than 0.05, indicating that there was no proportional difference between the PaCO2 and EtCO2. The correlation analysis showed that the two measurements were highly correlated (r=0.89, P<0.0001). Combined with the Bland-Altman map, the EtCO2 could replace the PaCO2 during TLV.
The analysis of the 172 paired PaCO2-EtCO2 data during OLV is shown in (Figure 2A). The LoA was (-4.657 to 10.2894) and the 95% CI of the LoA was (-5.6383 to 11.272). Five points were outside the 95% CI of the LoA. The 95% CI of the LoA was outside the maximum allowable difference (-5 to 5). Therefore, the EtCO2 could not replace the PaCO2 during OLV.
Moreover, 72.09% of patients had EtCO2 values within 5 mmHg of their paired PaCO2 values during OLV. Patients who had PaO2/FiO2 ratios of <200 mmHg had a lower ratio of agreement than those with ratios of >200 mmHg (55.88% vs. 81.73%, P=0.0001) (Figures 2B & 2C).
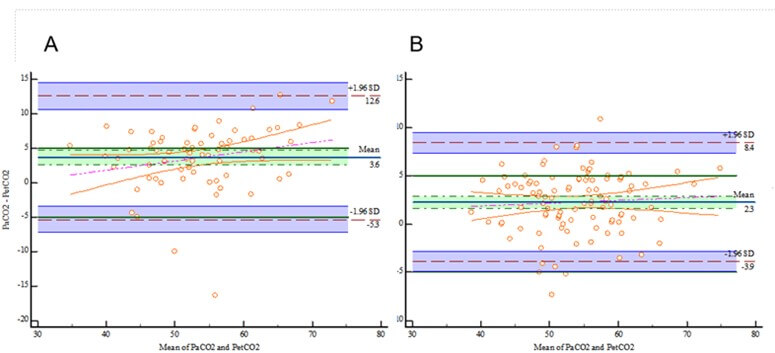
The blue line represents bias. The limits of agreement are indicated with brown lines and adjusted for repeated measures. A priori limits of acceptable agreement are represented by blue lines. Marginal histograms describe the distribution of values between pairs. A) Bland-Altman analysis comparing the PaCO2 and EtCO2 for all patients. B) Bland-Altman analysis comparing the PaCO2 and EtCO2 for patients who had PaO2/FiO2 values of <200 mmHg. C) Bland-Altman analysis comparing the PaCO2 and EtCO2 for those who had PaO2/FiO2 ratios of ≥200 mmHg.
The details of the Bland-Altman diagram are provided as follows. For (Figure 2A), the mean PaCO2-EtCO2 difference was 2.8169 mmHg; the 95% CI was 2.2430 to 3.3907, excluding 0; and the P-value was <0.0001, rejecting H0 at α=0.05. The difference can be considered significant. For the Bland-Altman regression equation, y = -1.1166 + 0.07339x, the 95% CI of the overall intercept was -5.4136 to 3.1803, with P=0.6086. The 95% CI of the slope was -0.006073 to 0.1528 (including 0) with P=0.07, rejecting H0 at α=0.05. A proportional difference did not exist between the measurements.
CI: Confidence Interval; EtCO2: End-Tidal Carbon Dioxide; FiO2: Fraction Of Inspired Oxygen; PaCO2: Partial Pressure Of Carbon Dioxide; PaO2: Arterial Oxygen Partial Pressure.
3.2. Deming Regression
The Deming regression equation was y = 0.8362 + 0.9336x, and the 95% CI of the overall intercept α was -3.5366 to 5.2090 (including 0), while the 95% CI of the regression coefficient β was 0.8536 to 1.0136 (including 1). There was no evidence of constant or proportional deviations (Figure 3A). In the residual map, each point was randomly and evenly distributed at the upper and lower ends of the reference line (y=0) without any trend, indicating that the data fitted the line regression equation (Figure 3B).
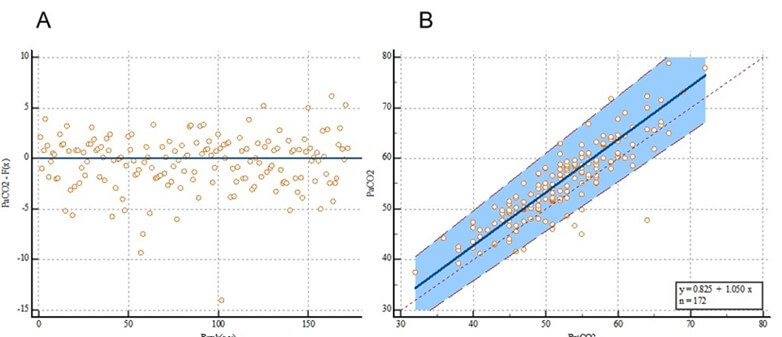
EtCO2: End-Tidal Carbon Dioxide; PaCO2: Partial Pressure of Carbon Dioxide.
3.3. Passing-Bablok Regression
The passing-Bablok regression equation was y = -0.785714 + 0.952381x. The overall intercept was α=-0.7857, and the 95% CI was -4.4286 to 3.0000 (including 0). There was no evidence of systematic differences at α=0.05. The overall slope β was 0.9524, with a 95% CI of 0.8824 to 1.0204 (including 1). There was no evidence of proportional differences at α=0.05. For this case, 95% (164/172) of the residues were within the ±1.96 residual standard deviation interval: 2.7139 (-5.3193 to 5.3193) (Figure 4A). The fitted passing-Bablok regression line almost overlapped with the identification line of y=x, with 164/172 points falling within the 95% confidence band of the passing-Bablok regression line (Figure 4B).
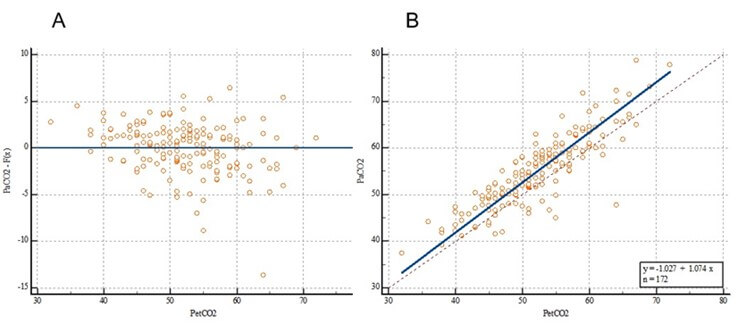
EtCO2: End-Tidal Carbon Dioxide; PaCO2: Partial Pressure of Carbon Dioxide.
No significant deviation was observed in the linear simulation (P=0.59). Combined with the systematic, proportional, and random differences, the regression measurements indicated that PaCO2 and EtCO2 were highly correlated (Spearman grade correlation coefficient r=0.8708).
3.4. Dead Space
The median (IQR) dead-space fraction increased significantly at T2 than that at T1 [6.89% (2.94, 9.83)] vs. [3.88% (2.28, 5.47)], P<0.0001.
3.5. Possible Factors Associated with Disagreement between the PaCO2 and EtCO2
Univariable analysis detected two variables, including younger age and low tidal volume ventilation as possible risk factors associated with disagreement between the PaCO2 and EtCO2 (P<0.05) (Table 1). Multivariable logistic regression showed low tidal volume ventilation was risk factor of disagreement.
4. Discussion
The study mainly revealed that EtCO2 could replace PaCO2 during TLV but not during OLV, especially among patients with PaO2/FiO2 ratios of <200 mmHg. The results highlight the importance of further defining the role of capnography and incorporating PaCO2 measurements during OLV in young children. Anatomic and physiologic dead spaces result in higher PaCO2 than the simultaneously obtained EtCO2 values. In young children, the costal cartilage is unable to support the dependent lung, leading to pressure transmitted from the abdominal cavity through the diaphragm compressing the dependent lung. Additionally, airway closure is more likely under tidal volume breathing owing to the functional residual volume being close to the closing volume in young children. Moreover, children have a smaller hydrostatic pressure difference between the affected lung and the healthy side compared to adults, hindering effective transfer of blood flow from the affected lung to the healthy side. Finally, young children are in a hypermetabolic state. The above reasons all hamper efficient exchange of CO2 between alveolar air and pulmonary capillary blood flow, resulting in a greater difference between PaCO2 and EtCO2 [19, 20]. This leads to a higher dead space ratio during OLV than during TLV.
We observed a negative difference between the PaCO2 and EtCO2 for several of our paired measurements. This negative difference may be attributable to the accumulation of exhaled CO2 in the ventilation circuitry before the EtCO2 measurement or poor equipment calibration. Additionally, CO2 was entering into the respiratory system from a source other than blood which can happen with thoracic CO2 insufflation for thoracic videoscopy, where exogenous CO2 can enter directly into the respiratory system from pleural spaces and lung interstitium. However, we avoided dips by obtaining the PaCO2 and EtCO2 simultaneously.
Lee et al. [21] reported that end-tidal measurements poorly correlated with arterialized capillary blood gas analyses in a clinically representative sample of newborns monitored during general anesthesia and surgery. A difference between the methods of <7.5 mmHg (1 kPa) was a priori considered clinically acceptable. Differences in age and the definition of agreement between the PaCO2 and EtCO2 may have contributed to the variations in results. To reflect clinical practice, we defined agreement using a narrower range (PaCO2-EtCO2 <5 mmHg) and paired the data within clinically reasonable intervals. This approach may result in lower levels of agreement. Additionally, low tidal volume ventilation was risk factor associated with disagreement between the PaCO2 and EtCO2, and this finding was consistent with previous study on adults [22]. The theoretical relationship between the PaCO2 and EtCO2 difference and saturation are defined by equation: (PaCO2 - EtCO2) = 5.5+0.9×EtCO2-0.0021×Vt [23], where Vt is the tidal ventilation. The accuracy of this formula has been extensively validated in adults, but not reported in detail in pediatrics. Low tidal volume ventilation This may be related to a greater rate of disagreement in the right lung surgery.
This study has several strengths, including a relatively large sample, a priori analytic framework, and examination of the association between PaCO2-EtCO2 agreement and hypotension. Furthermore, the paired data had minimal time gaps, which enhanced the precision of our findings. However, we must acknowledge the limitations of our study. The generalizability of our findings may be limited, as the data were obtained from a single hospital. Additionally, the age limitation in our study may also impact the generalizability of the results. Finally, a larger sample size is required for the risk factor analysis.
Implication Statement
The analysis included 172 patients aged <2 years who required one-lung ventilation while undergoing thoracoscopic surgery because of congenital cystic adenomatoid malformations. The PaCO2-EtCO2 agreement was defined as a PaCO2 within 5 mm of the paired EtCO2, and it was determined using Bland-Altman analysis, passing-Bablok regression, and Deming regression. Bland-Altman analysis revealed EtCO2 can be considered to replace PaCO2 during two lung ventilation. However, the dead-space fraction during OLV increased and the agreement was low, especially for patients with PaO2/FiO2 ratios of <200 mmHg. Low tidal volume ventilation was possible risk associated with disagreement between PaCO2 and EtCO2. Therefore, EtCO2 should not be substituted for PaCO2 for young children undergoing OLV. This study has several strengths, including a relatively large sample, a priori analytic framework, and examination of the association between PaCO2-EtCO2 agreement and hypotension. Furthermore, the paired data had minimal time gaps, which enhanced the precision of our findings. This was the first study investigating the agreement of PaCO2 and EtCO2 in children requiring OLV.
Funding
The present study was supported by grants from the National Natural Science Foundation of China (82371289).
Presentation
None.
Acknowledgments
We thank our professional colleagues within the Department of Anesthesiology, Shanghai Children’s Hospital and Shanghai Children's Medical Center for the assistance.
Conflicts of Interest
None.
Data Statement
Our research team could provide original data under reasonable request and with permission from Shanghai Children’s Hospital.
REFERENCES
[1] P
G Woodgate, M W Davies “Permissive hypercapnia for the prevention of morbidity
and mortality in mechanically ventilated newborn young children.” Cochrane
Database Syst Rev, vol. 2001, no. 2, pp. CD002061, 2001. View at: Publisher Site | PubMed
[2] J
R Kaiser, C H Gauss, M M Pont, et al. “Hypercapnia during the first 3 days of
life is associated with severe intraventricular hemorrhage in very low birth
weight young children.” J Perinatol, vol. 26, no. 5, pp. 279-285, 2006.
View at: Publisher
Site | PubMed
[3] Ulrich
H Thome, Waldemar A Carlo “Permissive hypercapnia.” Semin Neonatol, vol.
7, no. 5, pp. 409-419, 2002. View at: Publisher Site | PubMed
[4] Lauren
C Weeke, Laura M L Dix, Floris Groenendaal, et al. “Severe hypercapnia causes
reversible depression of aEEG background activity in neonates: an observational
study.” Arch Dis Child Fetal Neonatal Ed, vol. 102, no. 5, pp.
F383-F388, 2017. View at: Publisher Site | PubMed
[5] D
Yildizdaş, H Yapicioğlu, H L Yilmaz, et al. “Correlation of simultaneously
obtained capillary, venous, and arterial blood gases of patients in a
paediatric intensive care unit.” Arch
Dis Child, vol. 89, no. 2, pp. 176-180, 2004. View at: Publisher Site | PubMed
[6] J
M Badgwell, M E McLeod, J Lerman, et al. “End-tidal PCO2 measurements sampled
at the distal and proximal ends of the endotracheal tube in young children and
children.” Anesth Analg, vol. 66, no. 10, pp. 959-964, 1987. View at: PubMed
[7] Amir
Kugelman, Dana Zeiger-Aginsky, David Bader, et al. “A novel method of distal
end-tidal CO2 capnography in intubated young children: comparison with arterial
CO2 and with proximal mainstream end-tidal CO2.” Pediatrics,
vol. 122, no. 6, pp. e1219-e1224, 2008. View at: Publisher Site | PubMed
[8] Naveen
Eipe, Dermot R Doherty “A review of pediatric capnography.” J Clin Monit
Comput, vol. 24, no. 4, pp. 261-268, 2010. View at: Publisher Site | PubMed
[9] S
K Sharma, G P McGuire, C J Cruise “Stability of the arterial to end-tidal
carbon dioxide difference during anaesthesia for prolonged neurosurgical
procedures.” Can J Anaesth, vol. 42, no. 6, pp. 498-503, 1995. View at: Publisher
Site | PubMed
[10]
T Wesley Templeton, Federico
Piccioni, Debnath Chatterjee “An update on one-lung ventilation in children.” Anesth
Analg, vol. 132, no. 5, pp. 1389-1399, 2021. View at: Publisher Site | PubMed
[11] Change
Zhu, Rufang Zhang, Shenghua Yu, et al. “Effect of pressure controlled
volume guaranteed ventilation during pulmonary resection in children.” Sci Rep, vol. 12, no. 1, pp. 2242, 2022. View
at: Publisher Site | PubMed
[12]
Change Zhu, Mazhong Zhang, Saiji Zhang, et al. “Lung-protective
ventilation and postoperative pulmonary complications during pulmonary
resection in children: A prospective, single-centre, randomised controlled
trial.” Eur J Anaesthesiol, vol. 41, no. 12, pp. 889-897, 2024. View
at: Publisher Site | PubMed
[13] Jean S Bussières, Jacques Somma, José
Luis Carrasco Del Castillo, et al. “Bronchial blocker versus left double-lumen
endotracheal tube in video-assisted thoracoscopic surgery: A
randomized-controlled trial examining time and quality of lung deflation.” Can
J Anaesth, vol. 63, no. 7, pp. 818-827, 2016. View at: Publisher Site | PubMed
[14]
Ji-Hyun Lee, Jung-Il Bae, Young-Eun
Jang, et al.
“Lung protective ventilation during pulmonary resection in children: a
prospective, single-centre, randomised controlled trial.” Br J Anaesth,
vol. 122, no. 5, pp. 692-701, 2019. View at: Publisher Site | PubMed
[15]
Gaston Murias, Lluís Blanch, Umberto
Lucangelo “The physiology of ventilation.” Respir Care, vol. 59, no. 11,
pp. 1795-807, 2014. View at: Publisher Site | PubMed
[16]
J Martin Bland, Douglas G Altman
“Agreement between methods of measurement with multiple observations per
individual.” J Biopharm Stat, vol. 17, no. 4, pp. 571-582, 2007. View
at: Publisher Site | PubMed
[17]
H Passing, Bablok “A new biometrical
procedure for testing the equality of measurements from two different
analytical methods: application of linear regression procedures for method
comparison studies in clinical chemistry, Part I.” J Clin Chem Clin Biochem,
vol. 21, no. 11, pp. 709-720, 1983. View at: Publisher Site | PubMed
[18]
R F Martin “General Deming regression
for estimating systematic bias and its confidence interval in method comparison
studies.” Clin Chem, vol. 46, no. 1, pp. 100-104, 2000. View at: PubMed
[19]
C E Klopfenstein, E Schiffer, C M
Pastor, et al. “Laparoscopic colon surgery: unreliability of end-tidal CO2
monitoring.” Acta Anaesthesiol Scand, vol. 52, no. 5, pp. 700-707, 2008.
View at: Publisher Site | PubMed
[20]
Ryan Davis, Elizabeth Jewell, Milo
Engoren, et al. “Difference between arterial and end-tidal carbon dioxide and
adverse events after non-cardiac surgery: a historical cohort study.” Can J
Anaesth, vol. 69, no. 1, pp. 106-118, 2022. View at: Publisher Site | PubMed
[21]
Victoria Karlsson, Bengt Sporre, Lena
Hellström-Westas, et al. “Poor performance of main-stream capnography in
newborn young children during general anesthesia.” Paediatr Anaesth,
vol. 27, no. 12, pp. 1235-1240, 2017. View at: Publisher Site | PubMed
[22] Andrew D
Maslow, Todd S Stafford, Kristopher R Davignon, et al. “A randomized comparison of different ventilator
strategies during thoracotomy for pulmonary resection.” J Thorac Cardiovasc
Surg, vol. 146, no. 1, pp. 38-44, 2013. View
at: Publisher Site | PubMed
[23] P A Robbins, J Conway, D A Cunningham, et al. “A comparison of indirect methods for continuous estimation of arterial PCO2 in men.” J Appl Physiol (1985), vol. 68, no. 4, pp. 1727-1731, 1990. View at: Publisher Site | PubMed