Received: Wed 10, Dec 2025
Accepted: Tue 06, Jan 2026
Abstract
Background: Radioactive iodine (¹³¹I) therapy remains the cornerstone for treating differentiated thyroid cancer (DTC) with distant metastasis. However, a substantial subset of patients exhibit ¹³¹I-refractory disease (RAIR-DTC), characterized by poor iodine uptake and limited response to conventional treatment. Accurate early prediction of iodine avidity and therapeutic efficacy is crucial for personalized intervention strategies, yet traditional clinical models often fail to capture the complex biological heterogeneity of RAIR-DTC.
Methods: A retrospective single-center study was conducted using data from 439 DTC patients with pulmonary metastases treated between 2007 and 2020. A total of eight machine learning classifiers—including support vector machine (SVM), XGBoost, and CatBoost—were trained to predict ¹³¹I uptake and treatment response based on clinicopathological, biochemical, and treatment-related features. Feature selection was performed using correlation analysis and principal component analysis (PCA). Model performance was evaluated using accuracy, AUC, sensitivity, specificity, precision, and F1-score. SHAP (SHapley Additive exPlanations) was applied to interpret model predictions, and decision curve analysis (DCA) was used to assess clinical net benefit.
Results: For iodine uptake prediction, SVM achieved the highest AUC (0.8119), while CatBoost yielded the highest accuracy (0.8030) and specificity (0.9101). SHAP analysis identified age, serum thyroglobulin (Tg), pulmonary nodule size, and initial ¹³¹I activity as key predictive features, which are clinically associated with radioactive iodine (RAI) avidity. For treatment response prediction, random forest achieved the highest AUC (0.70), while soft voting yielded the highest F1-score (0.674). SHAP analysis indicated that age, pulmonary nodule size, initial ¹³¹I,activity, T stage, gender, and thyroglobulin (Tg) were the most influential predictors. Decision curve analysis (DCA) further demonstrated that XGBoost and CatBoost provided greater net clinical benefit across varying decision threshold.
Conclusion: This study demonstrates the feasibility and clinical relevance of multi-modal, interpretable machine learning models for predicting iodine uptake and treatment outcomes in metastatic DTC. By integrating SHAP and DCA, the framework provides both predictive accuracy and clinical decision support. Future efforts should include external validation, incorporation of molecular/radiomic features, and development of clinician-friendly tools to advance personalized care in RAIR-DTC management.
Keywords
Machine learning, SHAP analysis, thyroid cancer, distant metastasis
1. Introduction
Thyroid cancer is one of the most common endocrine malignancies, and its incidence has surged in recent years. However, approximately 10% of patients with differentiated thyroid cancer (DTC) experience disease recurrence, always characterized by extensive lymph node involvement and distant metastases [1]. Due to hemodynamic factors, the lungs are the most frequent site of distant metastasis, occurring in 3-20% of DTC patients and accounting for 55%-85% of all distant metastasis cases [2-4]. Although radioactive iodine (¹³¹I) therapy plays a central role in the management of metastatic DTC, there is significant heterogeneity in treatment response. A subset of patients exhibits poor sensitivity to ¹³¹I therapy, defined as radioactive iodine-refractory differentiated thyroid cancer (RAIR-DTC). According to the Chinese Management Guidelines for Radioactive Iodine-Refractory Differentiated Thyroid Cancer (2025 Edition) [5], RAIR-DTC is simplistically defined as: (1) all known DTC lesions demonstrate non-RAI-avidity and (2) despite RAI-avidity in some or all lesions, disease progression occurs within 1 year after RAI therapy (RAIT). Disease progression can be characterized by the presence of at least one of the followings: increasing levels of thyroglobulin (Tg) or thyroglobulin antibody (TgAb), enlargement of the persistent lesion or emergence of new lesions, worsening of prior disease-related symptoms, appearance of new disease-related symptoms, or disease-related death. Among all follicular cell-derived differentiated thyroid cancers, RAIR-DTC is associated with poor prognosis, with a 10-year survival rate of only 10% [6]. For these high-risk RAIR-DTC patients, early evaluation and risk prediction are crucial for informing timely clinical intervention and improving patient outcomes.
Prognostication and treatment response assessment for patients with distant metastases from thyroid cancer remain major challenges in clinical practice. Physicians must be able to stratify risk among metastatic patients and identify those with poor prognosis who may benefit from novel therapies or early enrollment in clinical trials. Currently, the assessment of distant metastases in thyroid cancer primarily relies on clinical characteristics, histopathological sub-types, molecular markers, age, sex, tumor size, and TNM staging. However, the prognostic value of these indicators varies considerably across studies. Traditional tools such as the TNM staging system and the American Thyroid Association (ATA) risk stratification guidelines [7] provide some degree of risk classification but are limited in their ability to predict individualized treatment responses with precision. Nomogram models, which offer intuitive graphical visualization and good clinical applicability, are based on generalized linear models (e.g., logistic regression). As such, they are inherently limited in capturing complex nonlinear relationships and higher-order interactions among features [8]. Therefore, there is a pressing need to develop a more accurate and flexible approach for evaluating the risk of distant metastasis in DTC.
In this context, there is increasing interest in leveraging machine learning (ML) methodologies to model the complex decision boundaries encountered in real-world clinical settings with greater precision. ML approaches have demonstrated strong potential in medical predictive modeling, offering the ability to integrate multi-modal data and automatically learn intricate feature relationships. Nevertheless, existing studies have largely focused on comparative performance evaluation of individual models, lacking comprehensive exploration of model interpretability and clinical decision optimization. Moreover, translating predictive outputs into actionable clinical strategies remains a critical challenge.
This study aims to develop a multi-modal machine learning ensemble framework that incorporates demographic parameters population character, clinicopathological features, imaging indicators, and treatment-related variables to enhance prognostic prediction for DTC patients with distant metastases. Furthermore, the study integrates SHAP (Shapley Additive Explanations) for model interpretability and decision curve analysis (DCA) to optimize clinical decision-making.
2. Method
2.1. Patients and Data Collection
This was a single-center retrospective study including patients with differentiated thyroid cancer (DTC) who received radioactive iodine (¹³¹I) therapy at Zhejiang Cancer Hospital between 2007 and 2020. Inclusion criteria were as follows: (1) patients who underwent total or near-total thyroidectomy; (2) histopathological confirmation of papillary or follicular thyroid carcinoma; (3) completion of standard ¹³¹I therapy; (4) evidence of pulmonary metastasis (with or without concurrent bone or lymph node metastases). Distant metastases, including those to the lungs, were confirmed using at least one of the following methods: (1) imaging modalities such as chest computed tomography (CT), ¹³¹I whole-body scan, ¹⁸F-fluorodeoxyglucose positron emission tomography/computed tomography (18F-FDG PET/CT), or magnetic resonance imaging (MRI); (2) elevated serum thyroglobulin (Tg) levels as a biomarker; (3) pathological confirmation of thyroid origin via surgical biopsy of metastatic lesions.
Clinical data at baseline and during follow-up were extracted from medical records and included demographic characteristics (age, sex), clinicopathological parameters (TNM staging, metastatic sites), ¹³¹I therapeutic dosages, and follow-up data (Tg levels and imaging outcomes). The study was approved by the Institutional Review Board of Zhejiang Cancer Hospital (Approval No. IRB-2024-53) and was conducted in accordance with the Declaration of Helsinki.
2.2. Treatment Protocol
Prior to ¹³¹I administration, patients discontinued thyroid hormone therapy for at least three weeks and followed a low-iodine diet for more than two weeks. Pre-treatment evaluations included chest CT, neck ultrasound, whole-body bone scintigraphy, and measurements of serum thyroid-stimulating hormone (TSH) and Tg levels. Additional assessments, including PET-CT or MRI, were performed as clinically indicated to evaluate tumor burden and staging. The administered activity of ¹³¹I was determined using an empirically fixed activity strategy based on established guidelines, considering factors such as patient age, body weight, and tumor burden [7]. Thyroid hormone suppression therapy was resumed two days after ¹³¹I treatment. Whole-body imaging using single-photon emission computed tomography (SPECT), with or without CT fusion, was performed 3-4 days post-therapy to assess ¹³¹I uptake and lesion distribution.
2.3. Evaluation of Therapeutic Efficacy
Therapeutic response to ¹³¹I was assessed using imaging studies (including CT and others) and serum stimulated thyroglobulin (sTg) levels, measured after at least three weeks of thyroid hormone withdrawal. CT-based evaluations were performed according to the Response Evaluation Criteria in Solid Tumors (RECIST) version 1.1 by two independent radiologists with over 10 years of experience.
Patients were classified into the ¹³¹I-avid group if metastatic lesions showed persistent ¹³¹I uptake during both initial and subsequent therapies. While those classified as non-¹³¹I-avid if lesions showed no ¹³¹I uptake at any time point (primary non-avidity), or if ¹³¹I uptake was observed in the first treatment but lost in subsequent therapies (secondary non-avidity). Response criteria were as follows:
(1) Complete Response (CR): No structural lesions with sTg levels reduced to the normal range (<10 ng/mL).
(2) Partial Response (PR): >25% decrease in sTg or ≥30% reduction in lesion size on imaging.
(3) Stable Disease (SD): ≤25% change in sTg and no significant radiographic progression.
(4) Progressive Disease (PD): >25% increase in sTg or radiographic evidence of lesion enlargement or new lesion development.
In cases of inconsistency between sTg levels and CT imaging, the imaging findings were used to determine the therapeutic outcome. If post-treatment imaging showed no structural or functional lesions and both suppressed Tg and sTg levels were ≥1 μg/L and ≥10 μg/L, respectively, the patient was classified as PR. Conversely, if the imaging was negative and both Tg and sTg were ≤1 μg/L and ≤10 μg/L, respectively, the patient was classified as CR [9]. Patients with CR or PR were defined as the "effective treatment group," while those with SD or PD were classified as the "ineffective treatment group."
2.4. Model Validation and Statistical Analysis
All statistical analyses were performed using Python 3.8.0, with packages including scikit-learn, xgboost, lightgbm, catboost, imblearn, and shap and R software (version 4.3.0) to explore the relationship between different variables and the prognosis of the thyroid cancer patients. Raw data were first preprocessed by imputing missing values using multivariate Iterative Imputer.
To address class imbalance, Synthetic Minority Over-sampling Technique (SMOTE) was applied to the training set. Subsequently, eight machine learning classifiers—Logistic Regression, k-Nearest Neighbors, Support Vector Machine, Random Forest, XGBoost, LightGBM, CatBoost, and Multi-layer Perceptron—were trained and evaluated using a stratified 70/30 train-test split. Model performance was assessed based on Accuracy, Sensitivity, Specificity, Precision, F1 score, and area under the ROC curve (AUC). Also To enhance model stability and overall prediction performance, ensemble learning techniques—Voting and Stacking—were adopted based on the outputs of eight base classifiers (Supplementary Material 3).
Model interpretability was further investigated via SHAP (SHapley Additive exPlanations) for the XGBoost and Logistic Regression models to assess feature importance. A Pearson correlation heatmap andt-SNE projection were also generated to visualize feature relationships and sample clustering, respectively (Supplementary Materials 1 & 4). Final model performances were compared using bar charts, and all results were exported for further interpretation, the methodology used in this work is depicted in (Figure 1).
2.5. Feature Extraction
Ensure the quality of input data and improve the performance of machine learning models, feature extraction was performed using correlation analysis and Principal Component Analysis (PCA). Prior to PCA, all numerical features were standardized to zero mean and unit variance to ensure consistency across scales. Initially (Supplementary Material 2), a heatmap was generated to visualize the pairwise correlations among the numerical features. This enabled the identification of highly correlated variables, which may contribute to multicollinearity and potentially bias the learning process.
3. Result
3.1. Dataset Characteristics
The general characteristics of the patients are shown in (Table 1). A total of 439 patients were available in this study, the age ranges from 6 to 79 years old while the average age was 46.9. The total number of male patients was 143, accounting for 32.6% of the total number of thyroid patients. The total number of female patients was 296, accounting for 67.4% of the total number of the patients. In terms of the pathological, there were 381 cases (87%) belong to class 1 (PTC), and 50 (11.4%) and 8 (1.6%) belong to class 2 (FTC) and class 3 (PTC+FTC) respectively. With respect to metastatic distribution, 359 cases (81.8%) were classified as Class 1 (lung-only metastases), whereas 66 (15%) and 14 (3.2%) were categorized as Class 2 (lung and bone metastases) and Class 3 (other visceral metastases, such as liver and brain), respectively. The detail information for T stage, N stage, First_¹³¹I_activity, Pulmonary_nodule_size, Uptake ¹³¹I were displayed in (Table 1).
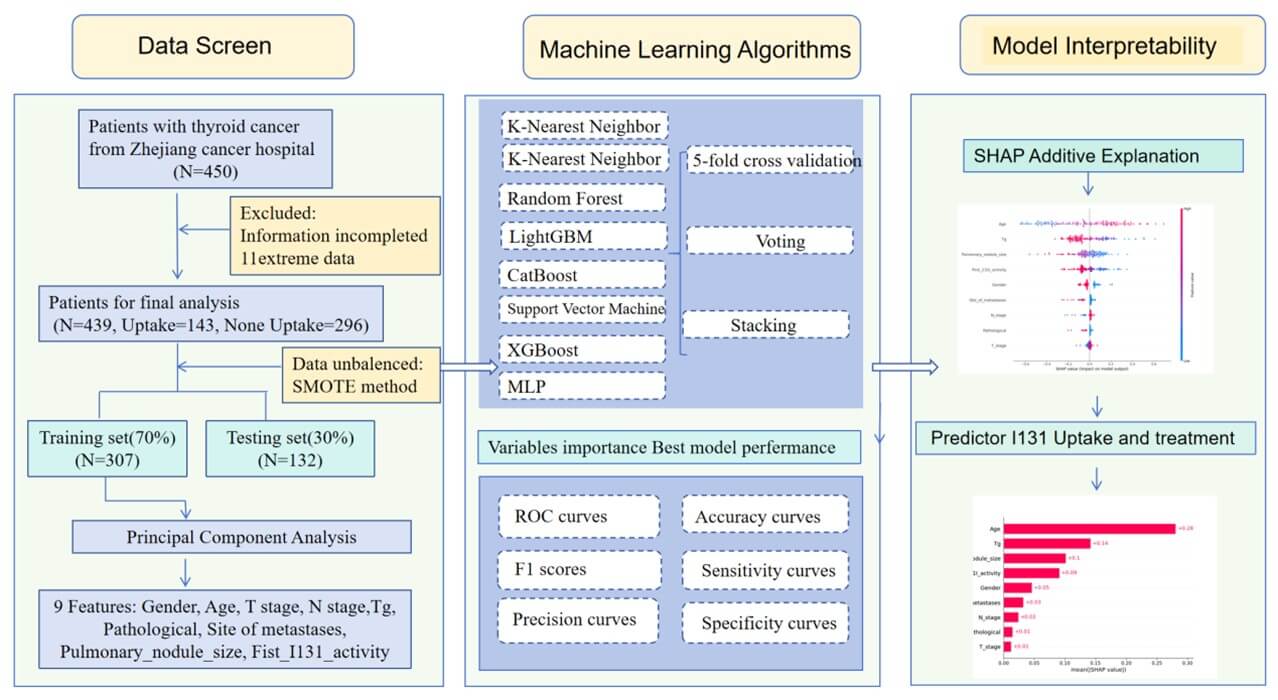
Table. 1. Baseline demographical and clinicopathological characteristics of
patients.
|
Demographic variable |
Category |
Number |
Percentage |
|
Gender |
Male |
143 |
32.6% |
|
Female |
296 |
67.4% |
|
|
Age |
Under 18 |
17 |
3.9% |
|
18-60 |
321 |
73.1% |
|
|
Above 60 |
101 |
23% |
|
|
Pathological |
1 |
381 |
87% |
|
2 |
50 |
11.4% |
|
|
3 |
8 |
1.6% |
|
|
T stage |
T1 |
87 |
19.8% |
|
T2 |
98 |
22.3% |
|
|
T3 |
173 |
39.4% |
|
|
T4 |
81 |
18.8% |
|
|
N stage |
N1 |
71 |
16.2% |
|
N2 |
368 |
83.8% |
|
|
Site of metastases |
1 |
359 |
81.8% |
|
2 |
66 |
15% |
|
|
3 |
14 |
3.2% |
|
|
First_131I_activity |
0-150 |
99 |
22.6% |
|
150+ |
340 |
77.4% |
|
|
Pulmonary_nodule_size |
0-1 |
274 |
63.4% |
|
1-2 |
144 |
32.8% |
|
|
2-3 |
21 |
4.8% |
|
|
Uptake131I |
0 |
143 |
32.6% |
|
Non 0 |
296 |
67.4% |
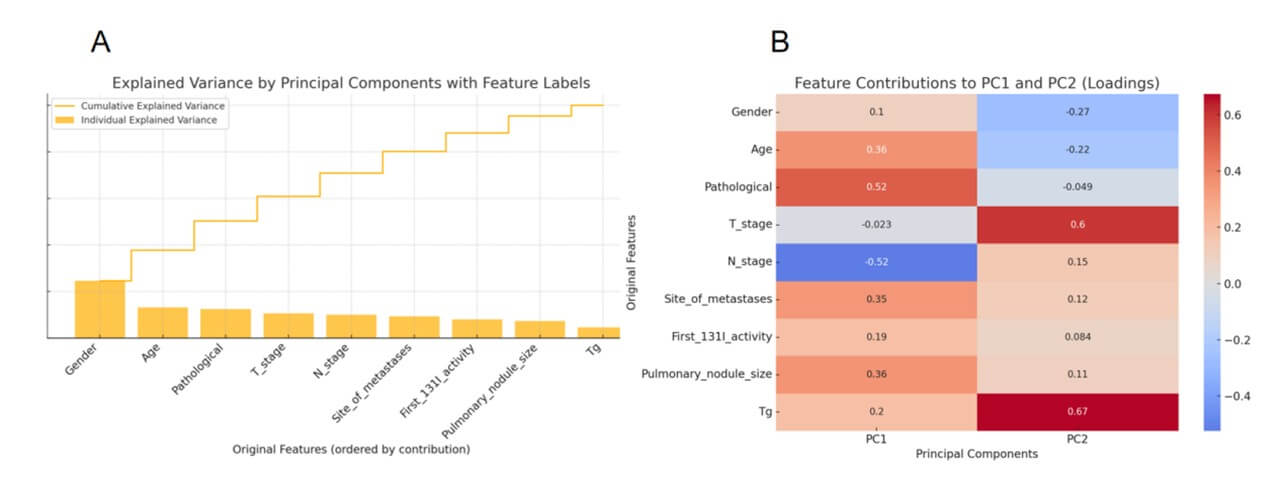
3.2. Principal Component Analysis
Principal Component Analysis (PCA) is a widely used unsupervised technique for reducing the dimensionality of high-dimensional datasets. Figure 2A presents the explained variance ratio for each principal component obtained through Principal Component Analysis (PCA). The bar plot shows the individual contribution of each component to the total variance, while the line plot illustrates the cumulative explained variance. Notably, the first two principal components together account for a significant portion of the total variance, justifying their use for dimensionality reduction and visualization. Figure 2B provides a heatmap of the loading scores, which quantify the contribution of each original variable to the first two principal components. Strong positive or negative loadings indicate that a variable heavily influences the direction of the corresponding component. For instance, Pathological and N_stage show large contributions to PC1 (negative), while T_stage and Tg dominate PC2 (positive).
3.3. Correlation Analysis
Correlation Analysis is used to measure the strength of the relationship between different features. Correlations analysis was carried out to find the association among different attributes of the patient data. Correlations were visualized by generating a heatmap (Supplementary 4). The graph displayed a correlation in color format and value between 0 to 1 positive whose color was red and 0 to -1 negative correlations whose color was blue, The result showed that the correlations among all the variables were significant, the detailed information was shown below.
3.4. ML Models
Based on the results of principal component analysis (PCA) and prior correlation analysis, a panel of clinically and biologically relevant features was selected to serve as input variables for iodine uptake prediction modeling. These features included age, serum thyroglobulin (Tg) level, pulmonary nodule size, first ¹³¹I activity, T stage, N stage, gender, pathological sub-type, and site of metastases.
Using this refined feature set, we developed and compared the classification performance of eight machine learning algorithms with the goal of accurately predicting the (¹³¹I) uptake status of metastatic lesions in differentiated thyroid cancer (DTC) patients. To evaluate the classification performance of eight machine learning models, the multiple metrics including Accuracy, Sensitivity (Recall), Precision, Specificity, F1 score, and Area Under the ROC Curve (AUC) were compared. The Results from all the developed models for predicting ¹³¹I uptake are shown in (Table 2 & Figure 3A). The findings indicated that Support Vector Machine (SVM) model achieved the highest AUC value (0.8119), indicating superior discriminative ability among all models. It also demonstrated a balanced performance across other metrics, with an Accuracy of 0.7652, Sensitivity of 0.7442, and F1 Score of 0.6737.
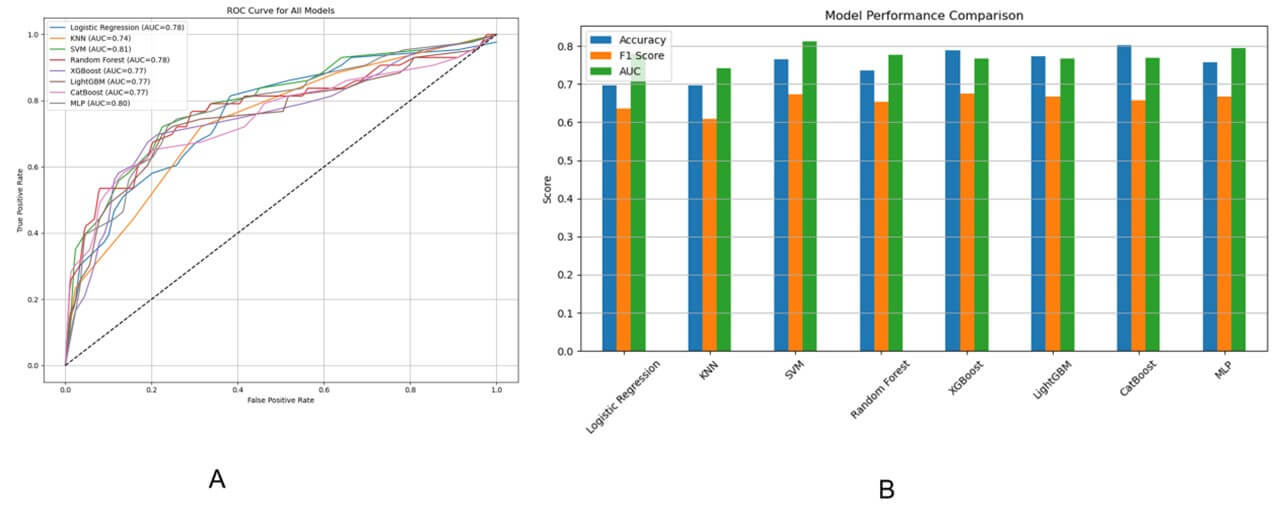
Table. 2. Comparison of machine learning models for predicting 131I
uptake status using PCA-selected clinical features.
|
|
Accuracy |
Sensitivity |
Precision |
Specificity |
F1 Score |
AUC |
|
Logistic Regression |
0.6969 |
0.8139 |
0.5223 |
0.6404 |
0.6363 |
0.7789 |
|
KNN |
0.6969 |
0.7209 |
0.5254 |
0.6853 |
0.6078 |
0.7411 |
|
SVM |
0.7651 |
0.7441 |
0.6153 |
0.7752 |
0.6736 |
0.8118 |
|
Random Forest |
0.7348 |
0.7674 |
0.5689 |
0.7191 |
0.6534 |
0.7763 |
|
XGBoost |
0.7878 |
0.6744 |
0.6744 |
0.8426 |
0.6744 |
0.7666 |
|
LightGBM |
0.7727 |
0.6976 |
0.6382 |
0.8089 |
0.6666 |
0.7661 |
|
CatBoost |
0.8030 |
0.5813 |
0.7575 |
0.9101 |
0.6578 |
0.7695 |
|
MLP |
0.7575 |
0.7441 |
0.6037 |
0.7640 |
0.6666 |
0.7951 |
CatBoost attained the highest overall Accuracy (0.8030) and outperformed other models in Precision (0.7576) and Specificity (0.9101), suggesting it is highly reliable in correctly identifying negative samples. However, its relatively low Sensitivity (0.5814) indicates that it may underperform in detecting positive cases. XGBoost also showed strong performance, with high Accuracy (0.7879), balanced Precision and Recall (both 0.6744), and a solid AUC of 0.7667, MLP (Multi-layer Perception) yielded stable results with a good trade-off between Sensitivity (0.7442) and AUC (0.7951), making it another viable choice.
In contrast, KNN and Logistic Regression performed relatively poorly, both achieving an Accuracy of only 0.6970 and lower AUC values (0.7412 and 0.7789, respectively). These models may not be suitable for tasks requiring high discriminative power.
In summary, SVM emerged as the best-performing model in terms of overall classification ability, followed closely by CatBoost and Xgboost, which excelled in different metric dimensions. These conclusions are visually reinforced in Figure 3 (B) (Bar Chart), where Accuracy, F1 Score, and AUC are compared across all models.
In order to evaluate whether the model adds clinical or practical value across a range of threshold probabilities, a decision curve analysis (DCA) was further performed. The Decision Curve Analysis (DCA) plot provides an evaluation of the clinical usefulness of each predictive model by illustrating the net benefit across a range of threshold probabilities. A model provides clinical value only when its curve lies above both of these lines as shown in (Figure 4).
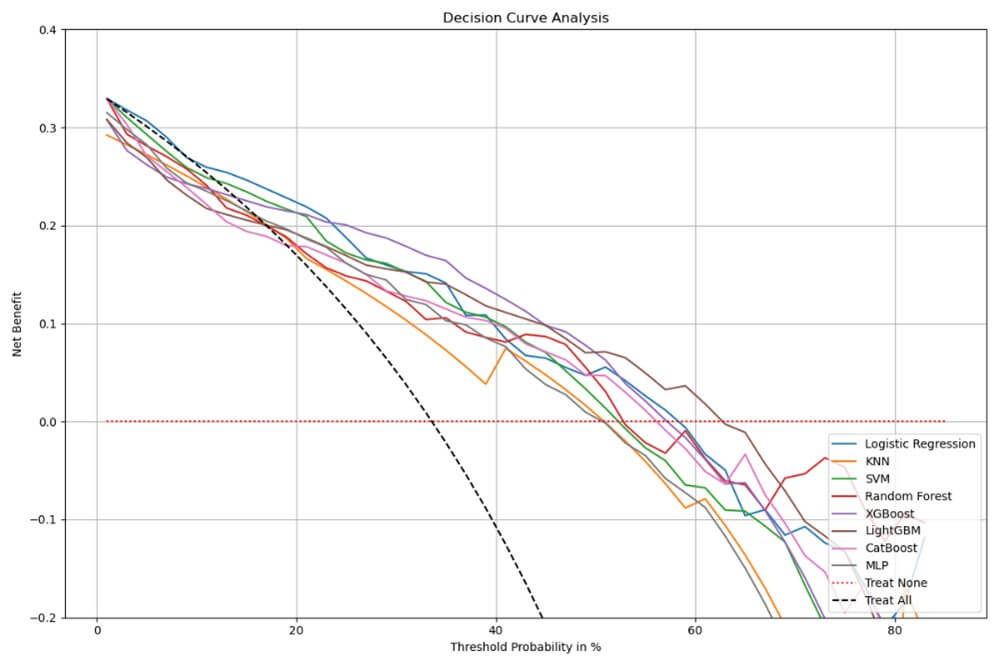
In this analysis, XGBoost and CatBoost consistently demonstrate higher net benefit across a wide range of threshold probabilities, particularly between 0% and 40%, indicating that these models support more effective clinical decision-making by identifying high-risk patients while minimizing unnecessary treatment. LightGBM and Logistic Regression also perform relatively well, while KNN shows the lowest net benefit, often falling below the“Treat All”line—suggesting it may lead to overtreatment without sufficient predictive accuracy to justify it.
Interestingly, although SVM achieves the best performance across multiple traditional classification metrics—such as AUC (0.81), F1-score, and specificity—this does not translate into the highest clinical utility in the DCA. A model may achieve high AUC and precision but still lead to sub-optimal treatment decisions if it does not align well with practical decision boundaries. DCA accounts for these considerations by explicitly incorporating threshold-based decision consequences. Therefore, while SVM is statistically strong, models like XGBoost and CatBoost may be more effective in practice due to their favorable benefit-risk trade-offs across decision thresholds.
3.6. Model Explanation with SHAP
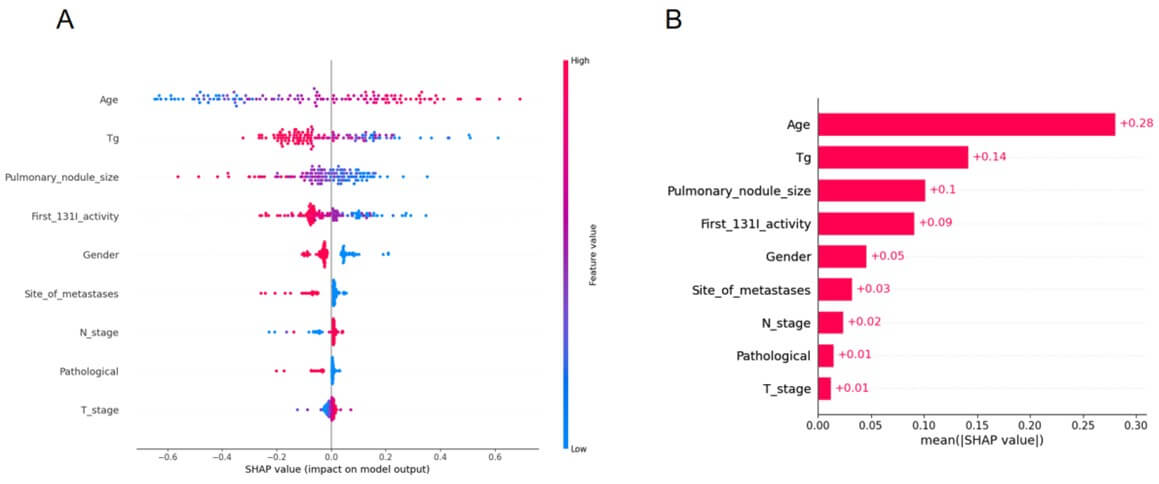
Machine learning models are often perceived as black box models, making it challenging to understand their internal mechanisms, To enhance the model’s interpretability, SHAP analysis was conducted, providing two types of explanations including global explanations at the feature level and local explanations at the individual level. As manifested in (Figure 5A), the SHAP value exhibited an upward trend in concert with the augmentation of age, along with Tg, Pulmonary_nodule_size, First_¹³¹I_activity, Gender, Site_of_metastases, N_stage, Pathological and T_stage, providing a more detailed view of the impact of each feature on individual predictions. Figure.5B displays the absolute values of the average SHAP values for different features.
3.7. Overall Efficacy Prediction
To evaluate the efficacy of machine learning models in predicting treatment response for pulmonary metastasis in thyroid cancer patients, nine clinical and pathological variables were used as input features. Multiple classification algorithms, including Logistic Regression, KNN, SVM, Random Forest, XGBoost, LightGBM, CatBoost, and MLP were trained and tested. Model performance was evaluated using key metrics such as Accuracy, F1 Score, and Area Under the ROC Curve (AUC), as shown in (Figure 6).
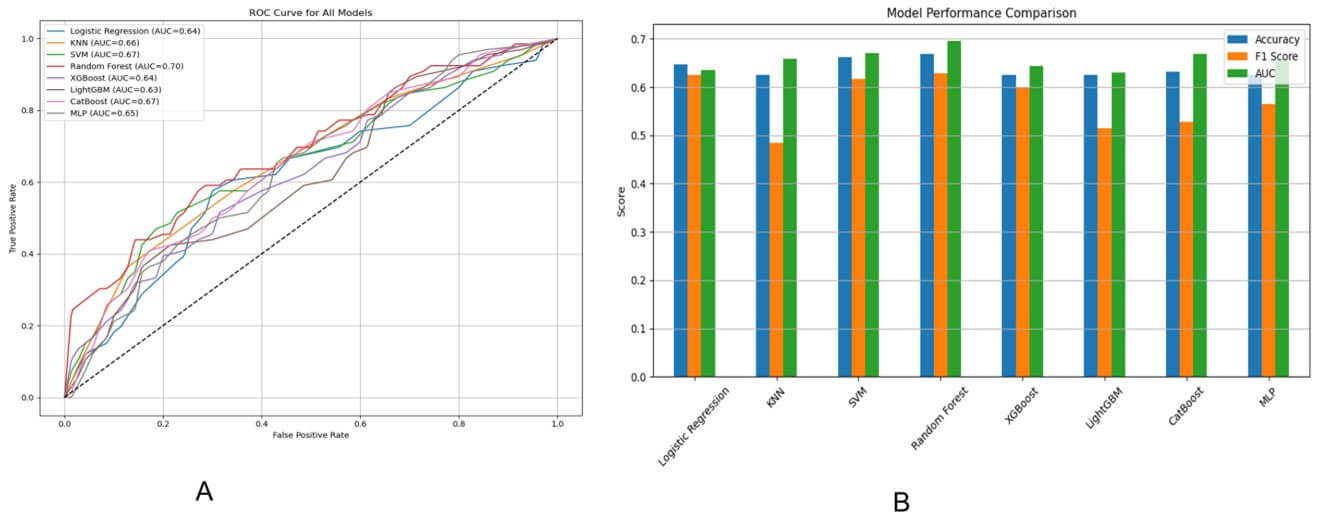
According to the ROC analysis (Figure 6A), the Random Forest model achieved the best overall discrimination ability with the highest AUC of 0.70, followed closely by SVM and CatBoost, each reaching an AUC of 0.67. Most models performed moderately, with AUC values ranging between 0.63 and 0.70. The bar chart (Figure 6B) comparing Accuracy, F1 Score, and AUC also highlighted Random Forest as the top-performing model across all metrics, with a notable balance between precision and recall (as reflected by its F1 Score). In contrast, KNN and LightGBM showed relatively lower F1 Scores, suggesting a poorer handling of class imbalance or model generalizability.
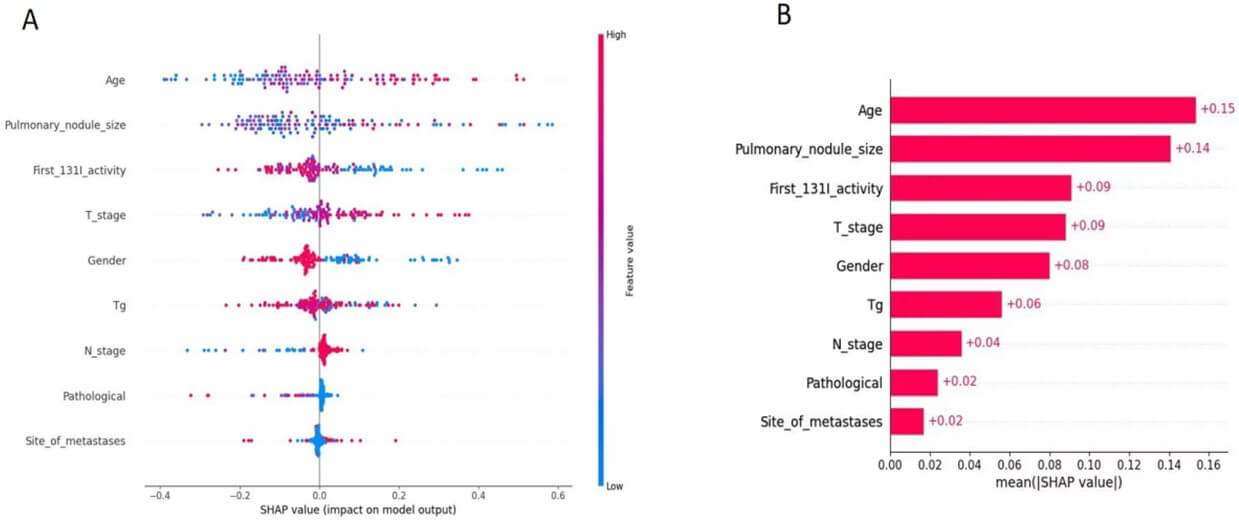
3.8. Model Explanation with SHAP for Treatment
Figure 7 presents the SHAP summary plot derived from the best-performing treatment response prediction model. Figure 7A, each dot represents a patient sample, with the x-axis denoting the SHAP value of a specific feature, indicating its positive or negative impact on the predicted probability of favorable treatment response. Features are ranked in descending order of their average importance. Color coding reflects the original feature value (red = high, blue = low).
As manifested in Figure 7B The analysis identifies thyroglobulin (Tg) level, age, number of metastatic lymph nodes, and initial ¹³¹I activity as top predictors. High Tg and advanced age are associated with reduced probability of treatment response, suggesting underlying tumor dedifferentiation and impaired iodine metabolism. In contrast, moderate lymph node burden and lower first-activity RAI activity correlate with better outcomes, potentially indicating less aggressive disease at baseline.
4. Discussion
This study explored the use of interpretable, multi-modal machine learning (ML) models to predict both radioactive iodine (RAI) uptake and treatment response in patients with metastatic differentiated thyroid cancer (DTC). Leveraging routinely collected clinical variables, we demonstrated the feasibility and utility of ML in supporting individualized decision-making for patients with high-risk disease, particularly those at risk for radioactive iodine-refractory DTC (RAIR-DTC).
Our findings revealed that Support Vector Machine (SVM) achieved the highest area under the curve (AUC) of 0.8119 for iodine uptake prediction, indicating strong discriminatory performance. CatBoost achieved the highest overall accuracy (0.8030) and specificity (0.9101), highlighting its effectiveness in correctly identifying patients without iodine uptake. While SVM demonstrated a good balance across all metrics, its relatively lower clinical utility observed in the decision curve analysis (DCA) suggests that high statistical performance does not necessarily translate into better clinical outcomes. Instead, XGBoost and CatBoost, despite slightly lower AUCs, yielded superior net benefit across clinically relevant threshold probabilities, indicating their stronger alignment with practical decision-making needs. This highlights the importance of combining performance metrics with clinical utility evaluations when assessing predictive models in real-world applications.
In contrast, treatment response prediction presented greater challenges. Despite the use of a comprehensive feature set and multiple classification algorithms, model performance remained moderate, with AUCs ranging from 0.63 to 0.70. The Random Forest model achieved the best overall performance, followed by SVM and CatBoost. The soft voting ensemble yielded the highest F1-score (0.674), suggesting that combining multiple classifiers improves robustness in the context of class imbalance and biological variability. However, these results underscore the intrinsic complexity of treatment response prediction, which is influenced by numerous post-treatment variables—such as immune status, tumor microenvironment, and TSH suppression—that are not captured in baseline datasets.
Model interpretability was a key focus in our study, addressed through SHAP (Shapley Additive Explanations) analysis. For iodine uptake prediction, SHAP identified age, serum thyroglobulin (Tg), pulmonary nodule size, and initial RAI activity as the most impactful features. Advanced age was associated with reduced iodine uptake [10], consistent with known biological mechanisms including age-related dedifferentiation [11], impaired sodium-iodide symporter (NIS) function [12], and increased genomic instability [13]. While our results align with these known trends, we acknowledge that the inferred links between SHAP-derived features and molecular mechanisms remain speculative. We have therefore revised related statements to present such interpretations more cautiously.
Thyroglobulin level, an established biomarker of tumor burden, also showed strong predictive value. Persistent Tg elevation post-surgery suggests residual or recurrent disease, even in the absence of iodine avidity, possibly due to partial retention of thyroid-like synthetic function despite NIS downregulation [14-18]. Pulmonary nodule size was another key factor; smaller nodules (typically < 1 cm) are more likely to retain NIS expression and be RAI-avid [19-20], whereas larger nodules are often hypoxic [21], necrotic, and less responsive to RAI due to dedifferentiation and perfusion barriers [22]. Together, these features serve as practical surrogates for underlying tumor biology and help guide clinical expectations regarding RAI effectiveness.
SHAP analysis for treatment response prediction highlighted age, Tg, lymph node burden, and initial RAI dose as influential variables. Elevated Tg and older age were associated with poor treatment response [23], again reflecting biological aggressiveness and impaired iodine metabolism [24, 25]. Interestingly, patients with a moderate number of lymph node metastases had better predicted outcomes compared to those with either minimal or extensive nodal involvement [26, 27]. This may reflect a "window of opportunity" in which the disease remains partially iodine-sensitive. Additionally, a higher initial RAI dose was paradoxically linked to poor outcomes [28], possibly because clinicians tend to escalate dose in patients with more aggressive or refractory disease—a confounding effect that ML models detect but cannot resolve causally [29-34].
Despite encouraging results, our study has several limitations. First, it is a retrospective single-center study, which may limit generalizability. Second, clinical labels such as "partial response" and "stable disease" inherently involve subjective interpretation and may introduce noise. Third, while our feature set captured key clinical and biochemical variables, molecular markers (e.g., BRAF V600E, TERT promoter mutations) and radiomic data were not included. These elements could significantly enhance predictive performance and mechanistic insight if incorporated in future studies.
From a clinical perspective, our proposed framework offers tangible utility. Physicians can use these models to stratify patients at high risk for RAI non-avidity or poor treatment response, and to make early decisions regarding alternative therapies such as tyrosine kinase inhibitors (TKIs) or external beam radiation therapy (EBRT). Importantly, the use of SHAP values ensures that predictions are explainable and aligned with clinical reasoning, increasing the likelihood of adoption in real-world practice.
In conclusion, this study provides a clinically interpretable and practical ML-based framework for early prediction of iodine uptake and treatment efficacy in metastatic DTC. Future directions include external validation with multi-center cohorts, integration of multi-omic data, and deployment of clinician-in-the-loop systems to ensure actionable, real-time decision support. With continued development, such models hold promise in advancing personalized care for patients with RAIR-DTC.
5. Conclusion
This study proposed a clinically interpretable, multi-modal machine learning framework to predict both radioactive iodine (¹³¹I) uptake and treatment response in differentiated thyroid cancer (DTC) patients with pulmonary metastases. By leveraging diverse clinical, pathological, and treatment-related variables, ensemble-based models—particularly SVM, XGBoost, and CatBoost—achieved high performance in identifying iodine-avid versus refractory disease. SHAP analysis elucidated the biological underpinnings of model predictions, highlighting age, serum thyroglobulin (Tg), pulmonary nodule size, and initial ¹³¹I activity as dominant factors linked to tumor differentiation and NIS function. Despite moderate accuracy in treatment response prediction, the model successfully captured meaningful clinical patterns, such as the negative impact of high Tg and age, and the nuanced role of lymph node burden. Furthermore, decision curve analysis confirmed the added clinical value of these models in guiding treatment decisions. This integrative framework not only improves prediction of RAIR-DTC but also enhances mechanistic understanding and supports personalized therapeutic strategies in metastatic thyroid cancer.
Acknowledgments
We would like to share our sincere gratitude to the staffs who are worked in Zhejiang Cancer Hospital for their contributions in data collection, maintenance, distribution and so on, and thanks to all the individuals who participated in this study.
Funding
This study was supported by Zhejiang Province Natural Science Foundation of China (Grant number: LTGY24H180013) and BK21 Four (Fostering Outstanding University for Research, No. 5120210913674) funded by the Ministry of Education (MOE, Korea) and National Research Foundation of Korea (NRF) and The National Innovation and Entrepreneurship Training Program for College Student (Grant number:202520343069).
Ethics Approval and Consent to Participate
This research has been performed in accordance with the Declaration of Helsinki and approved by Ethics Committee of Zhejiang Cancer Hospital. Writing informed consent was obtained from individual or guardian participants.
Data Availability
The dataset generated and/or analyzed during the current study are available from the corresponding author on reasonable request.
Consent for Publication
Not applicable.
REFERENCES
[1] Pepijn van Houten, Romana
T Netea-Maier, Johannes W Smit “Differentiated thyroid carcinoma: An update.” Best
Pract Res Clin Endocrinol Metab, vol. 37, no. 1, pp. 101687, 2023. View at:
Publisher Site | PubMed
[2] Zhong-Ling Qiu, Chen-Tian
Shen, Zhen-Kui Sun, et al. “Lung Metastases From Papillary Thyroid Cancer With
Persistently Negative Thyroglobulin and Elevated Thyroglobulin Antibody Levels
During Radioactive Iodine Treatment and Follow-Up: Long-Term Outcomes and
Prognostic Indicators.” Front Endocrinol (Lausanne), vol. 10, pp. 903,
2020. View at: Publisher Site | PubMed
[3] Jin-Seok Lee, Jun Sung
Lee, Hyeok Jun Yun, et al. “Prognosis of Anaplastic Thyroid Cancer with Distant
Metastasis.” Cancers, vol. 14, no. 23, pp. 5784, 2022. View at: Publisher Site | PubMed
[4] Xiaoli Liu, Yantao Fu,
Guang Zhang, et al. “miR-424-5p Promotes Anoikis Resistance and Lung Metastasis
by Inactivating Hippo Signaling in Thyroid Cancer.” Mol Ther Oncolytics,
vol. 15, pp. 248-260, 2019. View at: Publisher Site | PubMed
[5] Yan-Song Lin, Ren-Fei
Wang, Rui Huang, et al. “Chinese management guidelines for radioactive
iodine-refractory differentiated thyroid cancer (2025 edition).” Eur J Nucl
Med Mol Imaging, vol. 52, no. 10, pp. 3859-3876, 2025. View at: Publisher Site | PubMed
[6] Shereen Ezzat, Jesse D
Pasternak, Murali Rajaraman, et al. “Multidisciplinary Canadian consensus on
the multimodal management of high-risk and radioactive iodine-refractory
thyroid carcinoma.” Front Oncol, vol. 14, pp. 1437360, 2024. View at: Publisher Site | PubMed
[7] Bryan R Haugen, Erik K
Alexander, Keith C Bible, et al. “2015 American Thyroid Association Management
Guidelines for Adult Patients with Thyroid Nodules and Differentiated Thyroid
Cancer: The American Thyroid Association Guidelines Task Force on Thyroid Nodules
and Differentiated Thyroid Cancer.” Thyroid, vol. 26, no. 1, pp. 1-133,
2016. View at: Publisher Site | PubMed
[8] Shui Jin, Xuemei Ye, Ting
Ye, et al. “Nomogram models for predicting outcomes in thyroid cancer patients
with distant metastasis receiving 131iodine therapy.” Sci Rep, vol. 15,
no. 1, pp. 2486, 2025. View at: Publisher Site | PubMed
[9] Zhong-Ling Qiu, Hong-Jun
Song, Yan-Hong Xu, et al. “Efficacy and Survival Analysis of 131I Therapy for
Bone Metastases from Differentiated Thyroid Cancer.” J Clin Endocrinol Metab,
vol. 96, no. 10, pp. 3078-3086, 2011. View at: Publisher Site | PubMed
[10] Hervé Abdi, Lynne J.
Williams “Principal Component Analysis.” Wiley Interdisciplinary Reviews:
Computational Statistics, vol. 2, pp. 433-459, 2010. View at: Publisher Site
[11] Laurens van der Maaten,
Geoffrey Hinton “Visualizing High-Dimensional Data Using t-SNE.” Journal of
Machine Learning Research, vol. 9, no. 86, pp. 2579-2605, 2008.
[12] Edward Choi, Mohammad Taha
Bahadori, Joshua A. Kulas, et al. “RETAIN: An Interpretable Predictive Model
for Healthcare using Reverse Time Attention Mechanism.” Advances in Neural
Information Processing Systems, vol. 29, pp. 3504-3512, 2016. View at: Publisher Site
[13] Konstantina Kourou, Themis
P Exarchos, Konstantinos P Exarchos, et al. “Machine learning applications in
cancer prognosis and prediction.” Comput Struct Biotechnol J, vol. 13,
pp. 8-17, 2014. View at: Publisher Site | PubMed
[14] Scott Lundberg, Su-In Lee
“A unified approach to interpreting model predictions.” Advances in neural
information processing systems, vol. 30, 2017. View at: Publisher Site
[15] Liudmila Prokhorenkova,
Gleb Gusev, Aleksandr Vorobev, et al. “CatBoost: unbiased boosting with
categorical features.” Advances in neural information processing systems,
vol. 31, 2018. View at: Publisher Site
[16] Andrew J Vickers, Elena B
Elkin “Decision Curve Analysis: A Novel Method for Evaluating Prediction
Models.” Med Decis Making, vol. 26, no. 6, pp. 565-574, 2006. View at: Publisher Site | PubMed
[17] Lior Rokach
“Ensemble-based classifiers.” Artificial Intelligence Review, vol. 33,
pp. 1-39, 2010. View at: Publisher Site
[18] C Durante, N Haddy, E
Baudin, et al. “Long-Term Outcome of 444 Patients with Distant Metastases from
Papillary and Follicular Thyroid Carcinoma: Benefits and Limits of Radioiodine
Therapy.” J Clin Endocrinol Metab, vol. 91, no. 8, pp. 2892-2899, 2006.
View at: Publisher Site | PubMed
[19] Carla Colombo, Emanuela
Minna, Chiara Gargiuli, et al. “The molecular and gene/miRNA expression
profiles of radioiodine resistant papillary thyroid cancer.” J Exp Clin
Cancer Res, vol. 39, no. 1, pp. 245, 2020. View at: Publisher Site | PubMed
[20] Mingzhao Xing “Molecular
pathogenesis and mechanisms of thyroid cancer.” Nat Rev Cancer, vol. 13,
no. 3, pp. 184-199, 2013. View at: Publisher Site | PubMed
[21] Martin Schlumberger,
Bogdan Catargi, Isabelle Borget, et al. “Strategies of radioiodine ablation in
patients with low-risk thyroid cancer.” N Engl J Med, vol. 366, no. 18,
pp. 1663-1673, 2012. View at: Publisher Site | PubMed
[22] Park S et al.
“Differentiated thyroid carcinoma with pulmonary metastasis: CT findings.” Radiology,
vol. 256, no. 1, pp. 260-269, 2010.
[23] Riesco-Eizaguirre G,
Santisteban P “New insights in thyroid follicular cell biology and its impact
in thyroid cancer therapy.” Endocr Relat Cancer, vol. 14, no. 4, pp.
957-977, 2007. View at: Publisher Site | PubMed
[24] Jin Seong Cho, Jung Han
Yoon, Min Ho Park, et al. “Age and prognosis of papillary thyroid carcinoma:
retrospective stratification into three groups.” J Korean Surg Soc, vol.
83, no. 5, pp. 259-266, 2012. View at: Publisher Site | PubMed
[25] Jo S, Kim JH, Lim DJ, et
al. “High activity radioiodine therapy is not always effective for RAIR thyroid
cancer: impact of tumor biology over administered activity.” Endocrine,
vol. 69, no. 2, pp. 387-395, 2020.
[26] Katherine P Liao, Tianxi
Cai, Guergana K Savova, et al. “Development of phenotype algorithms using
electronic medical records and incorporating natural language processing.” BMJ,
vol. 350, pp. h1885, 2015. View at: Publisher Site | PubMed
[27] Yang AJ et al. “Tumor
microenvironment and immune-related biomarkers in radioactive iodine-refractory
differentiated thyroid cancer.” Frontiers in Endocrinology, vol. 12, pp.
737577, 2021.
[28] Song SY, et al. “Molecular
mechanisms of RAI resistance in thyroid cancer.” Nature Reviews
Endocrinology, vol. 16, no. 8, pp. 409-421, 2020.
[29] Liu R et al. “Genetic
alterations and their clinical implications in papillary thyroid carcinoma.” Nature
Reviews Endocrinology, vol. 15, no. 3, pp. 151-166, 2017. View at: Publisher Site | PubMed
[30] Zhou ZH “Ensemble methods:
foundations and algorithms.” CRC press, 2025.
[31] Omer Sagi, Lior Rokach
“Ensemble learning: A survey.” Wiley interdisciplinary reviews: data mining
and knowledge discovery, vol. 8, no. 4, pp. e1249, 2018. View at: Publisher Site
[32] Scott M Lundberg, Gabriel
Erion, Hugh Chen, et al. “From local explanations to global understanding with
explainable AI for trees.” Nat Mach Intell, vol. 2, no. 1, pp. 56-67,
2020. View at: Publisher Site | PubMed
[33] Jared L Katzman 1, Uri
Shaham 2 3 4, Alexander Cloninger, et al. “DeepSurv: personalized treatment
recommender system using a Cox proportional hazards deep neural network.” BMC
Med Res Methodol, vol. 18, no. 1, pp. 24, 2018. View at: Publisher Site | PubMed
[34] Eric J Topol “High-performance medicine: the convergence of human and artificial intelligence.” Nat Med, vol. 25, no. 1, pp. 44-56, 2019. View at: Publisher Site | PubMed