Received: Sat 01, Jul 2023
Accepted: Mon 17, Jul 2023
Abstract
Background: Sleeve gastrectomy (SG) is a valuable procedure in treating or improving obesity, the risk factor of Nonalcoholic Steatohepatitis (NASH). This study aimed to investigate the 12-week outcomes of SG in NASH-induced sprague-dawley rats. Methods: A 12-week high-fat diet-induced male sprague-dawley rat model of NASH (n=24; 6 weeks of age) was randomized into three groups; Sleeve gastrectomy (SG; n=8), Sham Surgery (SS; n=8), and Control (C; n=8). The SG and SS groups underwent surgery in week 12. Results: After 12 weeks of surgical intervention, rats in the SG group had significant weight reduction -16.5% (p < 0.001) but weight increment was seen in the SS and C groups; +1.9 % (p>0.05) and +10.0% (p<0.001), respectively. The SG group showed significantly lower serum levels of aspartate aminotransferase (AST) and alanine aminotransferase (ALT) as compared to the SS and C groups (p< 0.05). The serum levels of lipid profiles, inflammatory parameters and hepatic antioxidant capacities in the SG group were comparable to the SS group (p>0.05). In 24 weeks, the harvested livers showed no significant differences between the degrees of steatosis, ballooning, inflammation, and NAS in the SG group as compared to the SS groups (p>0.05). Conclusion: SG showed significant weight loss and liver function improvement with no improvement of liver histology, hepatic antioxidant activity, and inflammatory factors, in the NASH-induced animal model after 3 months. A longer-term study is warranted to confirm the benefits of SG in liver histology and other inflammatory factors.
Keywords
Non-alcoholic steatohepatitis, non-alcoholic fatty liver disease, sleeve gastrectomy, bariatric surgery, animal model
1. Introduction
Nonalcoholic fatty liver disease (NAFLD) is a metabolic disease and is strongly associated with obesity, insulin resistance, type 2 diabetes mellitus (T2D), and other cardiometabolic disorders [1, 2]. NAFLD is the most common cause of chronic liver disease with a global prevalence rate of 25%, with potential progression to NASH at 12-14% [3]. Nonalcoholic steatohepatitis (NASH) is a subgroup of NAFLD. NASH is characterized by active hepatocyte injury (ballooning), inflammation, and steatosis [4]. NASH can further progress to advanced liver fibrosis, cirrhosis, or liver cancer. The risk of NASH is two- to threefold higher in obesity, and it is among the top causes of liver cancer and the second most common indication for liver transplantation. This prevalence of NASH has increased the economic burden worldwide [4].
NASH is diagnosed based on liver biopsy. A specialized blood test and imaging can be conducted to determine the risk of significant fibrosis. The most effective treatment for NASH is weight reduction, low-calorie and saturated fat restriction, and exercise. To date, there are no approved medications for the treatment of NASH. There are some diabetes and anti-obesity medications that can be beneficial for NASH improvement [4]. Weight loss of 10% increases the benefits and may reverse steatohepatitis or liver fibrosis [5]. Although weight loss is the main approach to improve or even treatment of NASH [5], long-term adherence and sustainment to weight loss management with diet and lifestyle intervention were unsuccessful [6-8].
Bariatric surgery is known to be an effective treatment for obesity and reducing liver fat mass in the morbidly obese population [9]. Literature has shown that bariatric surgery improves the features of NASH, including steatosis, ballooning, inflammation, and fibrosis in NASH patients [9, 10]. Despite an abundance of observational studies and more recently randomized trials that explained the effects of bariatric surgery (BS) on NAFLD/NASH, the performance of a randomized clinical control trial (RCT) in humans as the gold standard is not available for BS due to ethical considerations; and it is an invasive procedure. Therefore, bariatric surgery on RCT animal model could provide a better understanding of its mechanism on improvement of NASH. Hence, this study was performed to study the outcomes of sleeve gastrectomy (SG) on NASH-induced sprague-dawley rats.
2. Materials and Methods
2.1. Ethical Approval
This study was approved by the animal ethics committee of universiti putra Malaysia (UPM) and Lorestan University of Medical Sciences (LUMS) (UPM/IACUC/AUP-R035/2019 and IR.LUMS.REC.1398.130). International programs to use and care for laboratory animals were followed to perform this experimental study.
2.2. NASH Induction Pilot Study
Before the accomplishment of the study, a pilot study was performed to induce NASH in sprague-dawley rat. To achieve this goal, twelve male sprague-dawley rats (n=12) aged 6 weeks, bodyweight 326±4.5 (g) were acquired from the pasteur institute of Iran. The rats were kept under standard conditions, including a temperature of 25-30 °C, 12 hours of light/darkness cycles, and relative humidity of 50-70%. Animal housing facilities of the vice chancellor for Research and Technology of Lorestan University of Medical Sciences (LUMS) of Iran were accepted to keep the rats.
After two weeks acclimatization, they randomly categorized into 2 main groups with 6 rats each group (sunflower oil and control) for the duration of 12 weeks (G12). The sunflower oil groups were fed with a standard chow diet (Behparvar company, Iran; 4.8% of energy from fat (soybean oil), 64.4% from carbohydrates, 23.1% from protein), gavage with sunflower oil (4 ml/kg per day), and had free access to sugary water (12% w/v). The control groups had the same diet regime, but the sunflower oil was replaced with a gavage of saline solution (4 ml/kg per day). At the end of 12 weeks period, the rats were sacrificed. The blood and livers were collected to determine indices of glycemic control, liver function, lipid profiles, and inflammatory parameters tests and liver histology.
2.3. Study Procedure
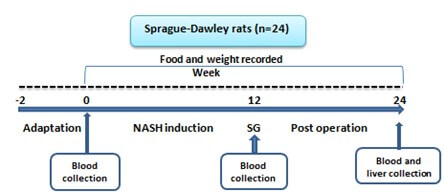
Twenty-four male sprague-dawley rats (n=24) aged 6 weeks were acquired from the pasteur institute of Iran. The rats were kept under standard conditions. After NASH induction periods (12 weeks) which the feeding protocol was same as NASH induction pilot study, rats were randomized into three groups; either sleeve gastectomy (SG, n=8), sham surgery (SS, n=8) or control (C, n=8). After the surgery was performed, all the 3 groups of rats were given a standard chow diet (Behparvar company, Iran) and water ad-libitum for 12 weeks. The diagram of study was shown in (Figure 1).
2.4. Outcome Variables
The rats’ body weights and the amount of the food consumed were recorded each week throughout the study period of 24 weeks. The blood samples were collected at initial day, week 12, and week 24 to assess serum aspartate aminotransferase (AST), alanine aminotransferase (ALT), gamma-glutamyl transferase (GGT), albumin, bilirubin, total protein, high-density lipoprotein-cholesterol (HDL-C), low-density lipoprotein-cholesterol (LDL-C), triglyceride (TG), total cholesterol (TC), high-sensitivity C-reactive protein (h-CRP), tumor necrosis factor α (TNF-α), and interleukin1 beta (IL-1β). These parameters were measured by a colorimetric analyzer (Olympus, AU400, Japan) using pars azmoon kits (Pars Azmoon Inc., Tehran, Iran) according to the manufacturer’s instructions. Based on protocols of manufacture, the levels of inflammatory parameters including h-CRP, TNF-α, and IL-1β were detected using elisa kits dedicated for rats (Elabscience, USA).
A 300 mg sample of the liver was taken and put in 3 mL cold buffer, which consists of 12 mM K2HPO4, 8 mM KH2PO4, and 1.5% KCl, with pH 7.4 for sample homogenization. These samples were centrifuged for 30 min at 4°C at 10000 × g. The hepatic TC and TG were assessed by the same procedure, using a kit for serum lipid profile. The homogenized samples were analyzed by elisa kits (Elabscience, USA) for the determination of glutathione (GSH), catalase (CAT), superoxide dismutases (SOD), glutathione peroxidase (GPx) of the livers using elisa kits definite for rats (Elabscience, USA). The data for the initial day and week 12 did not show in this study.
At 24 weeks, all the rats’ livers were harvested to measure the liver weight and obtain a liver biopsy in zone 3 for histology examination. Two independent reviewers of liver pathology who were expert to histological examination engaged in evaluating and calculating the scores of liver histology. They were blinded to the study's procedure and allocation of groups. These samples of liver tissues were fixed using a 10% neutral-buffered formalin solution. Afterward, hematoxylin and eosin (H&E) were used to stain the sliced fixed tissues. For histological evaluation, semi-quantitative scoring system of Kleiner et al. (2005) [11] was used (Table 1). This scoring system was used in other animal models [12, 13].
TABLE 1: Liver scoring
system [11].
|
Constituent |
Grade 0 |
Grade 1 |
Grade 2 |
Grade 3 |
Range |
||
|
Steatosis |
< 5% |
5–33% |
33–66% |
>66% |
0-3 |
||
|
Inflammation |
no foci |
<2
foci per 200 × field |
2–4
foci per 200 × field |
>4
foci per 200 × field |
0-3 |
||
|
Ballooning
|
none |
A small
number of balloon cells |
many
cells |
------------------- |
0-2 |
||
|
NAFLD activity score
(NAS) |
|
|
|
|
0-8 |
||
|
Categorization of NAS |
NAS ≥ 5
diagnosed as "NASH" |
|
|
||||
|
NAS
from 3 to 4 diagnosed as mild "NASH" |
|||||||
|
NAS ≤ 2
~ absence of NASH |
|||||||
2.5. Sleeve Gastrectomy
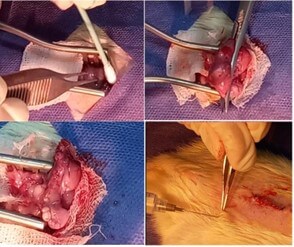
Both SG and SS groups rats were fasted 12 hours prior to sleeve gastrectomy (SG). They were anesthetized with a mix of ketamine (60 mg/kg) and xylazine (12 mg/kg) injection. Ceftriaxone was given prophylaxis (75 mg per kg). The SG was performed under sterile conditions. An incision (30-40 mm) was created in the midline abdominal to the level of the xiphoid cartilage to expose the stomach. The stomach was mobilized and sleeved to almost 70% of the stomach, where the proximal and distal stomach was removed during the procedure. The remaining stomach was closed with a 5/0 non-absorbable polypropylene suture. The stomach was returned to the abdominal cavity and two abdominal wall layers were closed using 4-0 silk sutures (Figure 2). The SS group had a similar surgical incision, the stomach was externalized but then returned to the abdominal cavity without any stomach excision.
2.6. Postoperative Care
Post-operative meloxicam was given subcutaneously at a dose of 1 mg/kg body weight every eight hours for 24 hours as analgesia. Postoperatively, each rat was placed individually in each cage for 14 days. The rats were kept fasted for the first 24 hours post-surgery and given intravenous fluids. On post-surgery day 2, they had access to oral rehydration salts and on post-surgery day 3-6, they received a liquid regime (entera meal, karen company, Iran; 13.3 kcal % protein, 67.26 kcal % carbohydrate, 15.9 kcal % fat). Then, on the 7th day, the rats had access to the liquid regime, water, and a completely crushed standard chow diet (behparvar company, Iran) (2 grams). Hereafter, the rats had access to a standard chow diet. On day 14 onwards, all the rats received a standard chow diet and water ad-libitum.
2.7. Definition
NASH is defined as the presence of ≥5% steatosis of the liver accompanied by inflammation and hepatocyte injury (hepatocyte ballooning), with or without a document of liver fibrosis. NAFLD activity score (NAS) is defined by unweighting compound of steatosis, lobular inflammation, and ballooning scores degree. Steatosis was determined based on the micro- or macro-vesicular hepatocytes fat percentage. Table 1 defined the liver histology grading [2, 11].
2.8. Statistical Analysis
Continuous data were reported as mean and standard deviation and advanced statistical analysis was performed using SPSS statistics software version 21 (IBM Corp., Armonk, NY, USA). One-way analysis of variance (ANOVA) with post hoc analysis was used to determine significant differences between variables. An independent sample t-test was applied for a comparison of quantitative data between two groups. For evaluation of histopathologic scoring, Kruskal–wallis test was utilized. In the present study, significance was assessed at p <0.05.
3. Results
3.1. NASH Induction Potential of Feeding Protocol
Force-feeding with sunflower oil accompanied with ad-libitum feeding with standard chow diet and a solution of sugar could induce a NASH model with pathology similar to NASH in humans, including obesity, histological aspects such as severe steatosis, mild to moderate hepatocellular ballooning, mild to moderate inflammation, disorders in glycemic control (high levels of fasting blood sugar (FBS) and insulin, and increasing MOMA-IR), lipid profiles (the elevated total cholesterol (TC), triglyceride (TG), and low-density lipoprotein-cholesterol (LDL-C) level, and decreasing high-density lipoprotein-cholesterol (HDL-C) levels), levels of inflammatory factors (increasing of interleukin1 beta (IL-1β), tumor necrosis factor α (TNF-α), and high-sensitivity C-reactive protein (hs-CRP)), liver function tests (the elevated levels of alanine transaminase (ALT); aspartate transaminase (AST) with no change in gamma-glutamyl transferase (GGT), bilirubin, and albumin) as shown in (Table 2).
TABLE 2: The level of
liver functions, lipid profiles, glycemic control parameters, inflammatory
factors tests, and liver histology in NASH induction groups at week 12 (G12).
|
Parameters |
Group |
p
value |
|
|
Sunflower
oil G12 |
Control G12 |
||
|
ALT(U/L) |
67.50±7.18 |
51.60±8.56 |
<0.01 |
|
AST(U/L) |
105.67±15.49 |
77.60±11.13 |
<0.01 |
|
GGT(U/L) |
3.83±0.75 |
3.20±0.84 |
NS |
|
Bilirubin
(mg/dl) |
0.97±0.51 |
0.88±0.08 |
NS |
|
Albumin
(mg/dl) |
3.60±0.18 |
3.48±0.36 |
NS |
|
HDL-C
(mg/dl) |
29.00±4.00 |
36.40±3.05 |
<0.01 |
|
LDL-C
(mg/dl) |
41.83±2.56 |
35.60±2.70 |
<0.01 |
|
TG
(mg/dl) |
84.17±16.17 |
62.40±9.79 |
<0.05 |
|
TC
(mg/dl) |
100.50±9.25 |
81.80±6.38 |
<0.01 |
|
FBS
(mg/dl) |
111.83±8.18 |
91.60±4.22 |
<0.01 |
|
Insulin
(pg/ml) |
4.83±0.26 |
4.18±0.16 |
<0.01 |
|
HOMA-IR |
1.34±0.15 |
0.95±0.07 |
<0.01 |
|
IL1β
(pg/ml) |
107.67±6.35 |
77.83±10.15 |
<0.001 |
|
TNF-α
(pg/ml) |
68.83±
10.54 |
58.83±
2.40 |
<0.05 |
|
h-CRP
(pg/ml) |
421.83±
36.93 |
364.33±
19.92 |
0.007 |
|
Liver
histology |
|
|
|
|
Steatosis
(0-3) |
3 ± 0.0 |
1.20 ±
0.45 |
<0.001 |
|
Ballooning
(0-2) |
1.33 ±
0.52 |
1.00 ±
0.0 |
NS |
|
Inflammation
(0-3) |
1.33 ±
0.52 |
1.00 ±
0.0 |
NS |
|
NAFLD
activity score (NAS) |
5.67 ±
0.52 |
3.20 ±
0.45 |
<0.001 |
The comparative effects of force-feeding
of sunflower oil (G12) on liver histology of rats to determine fatty change
including steatosis, inflammation, ballooning degeneration (Mann-Whiteny U
test), and NAS score (independent sample t-test). Other analysis was carried
out based on independent sample t-test. Values are indicated as mean ± SD. The
analysis was done on 6 rats in each group: alanine transaminase (ALT);
aspartate transaminase (AST); gamma-glutamyl transferase (GGT); high-density
lipoprotein-cholesterol (HDL-C). low-density lipoprotein-cholesterol (LDL-C);
triglyceride (TG); total cholesterol (TC); fasting blood sugar (FBS);
homeostasis model assessment-estimated insulin resistance (HOMA-IR). IL-1β;
interleukin1 beta, TNF-α;
tumor necrosis factor α,
hs-CRP; high-sensitivity C-reactive protein, G12; 12 week.
3.2. Body Weight, Food Intake Outcomes
At week 24, rats in the SG group showed a significant weight reduction as compared to their initial baseline weight (-16.5%; p<0.001). However, the weight of rats in the SS and C groups showed significant increments in week 24; +1.9% (p>0.05) and +10.0% (p<0.001), respectively (Figure 3 and Table 3). At the end of the study, the mean weight of rats in SG was significantly lower than SS, and the C groups (p<0.05) (Figure 3). Following SG, rats showed a remarkable decrease in food intake up to week 16 of the study. Then food intake gradually increased until week 24 of the study (Figure 4). No significant differences were seen between the food intake of SG and the SS group at the end of the study (P>0.05).
TABLE 3: The comparison of
outcomes in experimental groups.
|
Parameters |
|
|
group |
|
|
|
week |
SG |
SS |
C |
p value |
|
|
Body weight (g) |
0 |
308.83±
16.29 |
322.17±
22.89 |
329.33±
27.00 |
0.18 |
|
12 |
417.83±
24.39 |
397.50±30.00 |
391.33±
24.15 |
0.22 |
|
|
16 |
313.83±16.70ce |
363.50±21.88 |
393.00±29.00 |
<0.001 |
|
|
20 |
329.33±19.57cd |
372.67±20.37 |
406.00±25.57 |
<0.001 |
|
|
24 |
348.17±
15.11bd |
406.20±
53.0 |
430.17±22.18 |
0.003 |
|
|
P value for pre to post treatment |
0.001 |
0.51 |
<0.001 |
|
|
|
Absolute liver weight (g) |
24 |
8.80 ±
1.21 |
9.81±
0.58 |
10.18±
0.99 |
0.06 |
|
Relative liver weight (g) |
24 |
2.53±0.33 |
2.30±0.07 |
2.37±0.21 |
0.20 |
|
Liver
TG (Mg/g liver) |
24 |
47.83±12.03b |
59.50±8.50 |
75.17±
12.72 |
0.003 |
|
HC
(Mg/g liver) |
24 |
10.67±2.50b |
12.17±2.79 |
17.17±3.49 |
0.004 |
|
Total protein (mg/dl) |
24 |
6.97±0.39a |
6.83±0.25 |
6.40±0.33 |
0.02 |
|
Bilirubin(mg/dl) |
24 |
0.88±0.08 |
0.89±0.15 |
0.98±0.15 |
0.35 |
|
Albumin (mg/dl) |
24 |
3.65±
0.19 |
3.68±0.15 |
3.73±
0.28 |
0.79 |
|
ALT(IU/dL) |
24 |
38.83±
5.50cd |
50.00±
2.29 |
60.67±
7.76 |
<0.001 |
|
AST(IU/L) |
24 |
71.67±5.12ce |
95.67±12.16 |
122.17± 14.29 |
<0.001 |
|
GGT(IU/L) |
24 |
1.00±0.33 |
0.62±0.45 |
0.93±0.48 |
0.28 |
|
HDL-C
(mg/dl) |
24 |
39.17±
6.49 |
36.67±
5.04 |
35.50±
7.89 |
0.62 |
|
LDL-C
(mg/dl) |
24 |
52.33±
7.87b |
63.33±
5.17 |
69.17±
6.33 |
0.002 |
|
TG
(mg/dl) |
24 |
89.17±
8.40b |
99.33±12.37 |
114.50±11.78 |
0.004 |
|
TC (mg/dl) |
24 |
81.5±7.71b |
98.00±16.41 |
105.00±7.24 |
0.008 |
|
IL1β (pg/ml) |
24 |
87.67±
6.09b |
81.50±
8.01b |
104.17±
9.20 |
p<0.001 |
|
TNF-α (pg/ml) |
24 |
61.33±
11.96a |
54.00±
7.80c |
77.00±
10.01 |
0.004 |
|
h-CRP (pg/ml) |
24 |
406.50±
31.47 |
383.83±34.73b |
444.00±
28.50 |
0.02 |
|
GSH
(nmol/mg protein) |
24 |
61.33±9.14 |
66.50±8.17 |
56.67±7.81 |
0.16 |
|
CAT
(nmol/min/mg protein) |
24 |
286.67±42.80 |
298.17±42.99 |
244.00±33.47 |
0.08 |
|
SOD (U/mg
protein) |
24 |
48.33±12.94 |
53.17±9.40 |
33.00±5.37 |
0.06 |
|
GPx
(nmol/mg protein) |
24 |
410.00±70.11a |
422.17±70.05 |
301.33±73.47 |
0.02 |
|
Liver Histology |
|
|
|
|
|
|
The
degree of steatosis (0-3) |
24 |
2.00±0.00a |
2.33±0.52 |
2.67±0.32 |
0.05 |
|
Ballooning
(0-2) |
24 |
1.00±0.00 |
1.17±0.41 |
1.17±0.41 |
0.60 |
|
Inflammation
(0-3) |
24 |
1.50±0.55 |
1.83±0.41 |
2.00±0.00 |
0.12 |
|
NAS |
24 |
4.50±0.55a |
5.33±0.82 |
5.84±0.76 |
0.02 |
The analysis was carried
out based on one-way Anova and repeated measures ANOVA. Scores was announced as
mean ± SD. GGT: gamma-glutamyl transferase; ALT: alanine aminotransferase; AST:
aspartate aminotransferase; TG: triglyceride; TC: total cholesterol; HDL-C:
high-densitylipoprotein-cholesterol; LDL-C: low-density
lipoprotein-cholesterol; HC: hepatic cholesterol; IL-1β:
interleukin1 beta; TNF-α:
tumor necrosis factor α;
hs-CRP: high-sensitivity C-reactive protein; GSH: glutathione; CAT: catalase;
SOD: superoxide dismutases; GPx: glutathione peroxidase; NAS: NAFLD activity
score; SG: sleeve gasterectomy; Sham: SS control C. ap<0.05 compared with C
group; bp<0.01 compared with C group; cp<0.001 compared with C group;
dp<0.05 compared with SS group; ep<0.01 compared with SS
group.
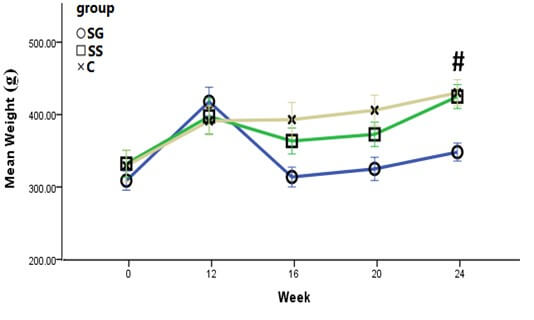
All data were reported as mean ± SD. There were no significant differences in mean weight of rats at initial, 12, 16, 20 weeks. #P<0.05 for SG compared with SS and C group.
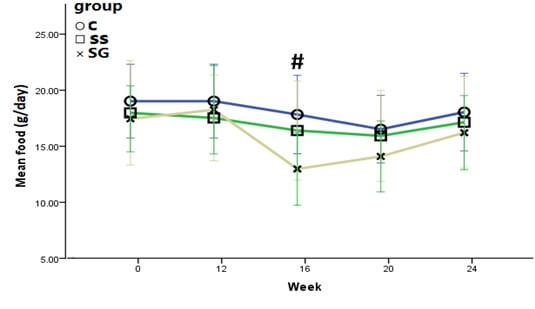
All data were reported as mean ± SD. There were no significant differences in food intake of experimental rats in the initial, 12, 20, and 24 weeks of study. #P<0.05 for SG compared with SS and C group.
3.3. Liver Function and Lipid Profiles Tests, and Liver Indicators
Table 3 shows the levels of liver function, lipid profiles, and liver indicators evaluations. AST and ALT levels in the SG group were significantly lower than the SS and C groups (P<0.05). However, there were no significant differences in levels of GGT, albumin, and total bilirubin between the SG, SS, and C groups in week 24 of the study (p>0.05). At this time, the serum lipid profiles (TC, TG, LDL-C, and HDL-C) in SG were comparable to SS group (p>0.05). At week 24, although the absolute liver weight in SG group was lower than SS group, it was not significant (p>0.05). Relative liver weight of rats in the SG group were comparable to SS and C groups (p>0.05).
3.4. Inflammatory Parameters and Hepatic Antioxidant Capacity
Table 3 shows the outcomes of inflammatory parameters including IL-1β, TNF-α, and hs-CRP and hepatic antioxidant capacity (GSH, CAT, SOD, and GPx) in the experimental groups at weeks 24. The results showed at this time, the levels of the inflammatory parameters and antioxidant factors in SG were not significant different as compared to SS group (p>0.05).
3.5. Histopathological Analyses
Histological evaluation showed that SG could improve liver histology through improvement of steatosis when compared with C group (p<0.05). However, the performance of SG did not effect on hepatic steatosis, ballooning, and inflammation when compared to the SS group (p>0.05) (Table 3). Figure 5 shows a photomicrograph of rats’ livers after SG; (a) showed moderate steatosis, mild/moderate ballooning, and mild/moderate inflammation. The micrograph of rats' liver tissues in SS (b) showed moderate/severe steatosis, mild/moderate ballooning, and mild/moderate inflammation. In the micrograph of C group (c), not only moderate/severe steatosis and mild ballooning but also a moderate degree of scattered inflammation can be observed.
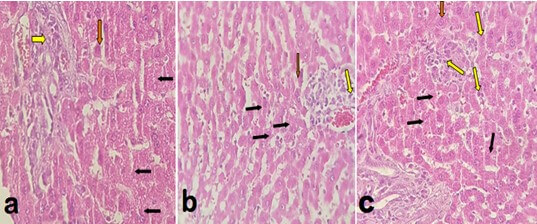
Histopathological evaluation of H&E staining of hepatic tissue collected from experimental rats which overfeed with High-Fat Diet to induce NASH then treated with SG. Photomicrographs (magnification, 200×) prepared from the tissues isolated from a) sleeve gastrectomy (SG); b) sham surgery (SS); c) Positive control group (C) group. In histological assessment, mainly the aspects of rats hepatosteatosis including; steatosis, ballooning, and inflammation were evaluated. Black arrows indicate hepatic steatosis. Yellow arrows reveal lobular inflammatory foci. Red arrows manifest ballooned hepatocytes. (Hematoxylin and eosin stained images were kindly provided by Dr. Mohsen Gheitasvand and Dr. Omid Ali Adeli, Lorestan University of Medical Sciences, Iran who were blinded to the procedure of group allocation.
4. Discussion
Our pilot study on SD rats fed with a standard chow diet added with gavage of sunflower oil and sugary water for 12 weeks was able to induce a similar NASH pathology as humans. The sunflower oil consumed by the rats was the source of omega (n)-6 polyunsaturated fatty acids (PUFAs) in this animal model. Studies have shown the inflammatory effect of n-6 PUFAs which exacerbates hepatic oxidative stress and enhances NASH expansion [14]. Excessive consumption of n-6 PUFAs causes an imbalanced ratio of n-6 / n-3 PUFAs, producing pro-inflammatory cytokines and may lead to NAFLD development [15, 16]. Zou et al. (2005) study on rats showed that force-feeding with a high-fat emulsion diet containing high amount of n-6 PUFAs could induce NASH at 6 weeks [17]. Yahaghi et al., (2019) conducted an experimental study to induce NASH in male C57BL/6J mice for 4 weeks. They showed that NASH and fibrosis can be created in mice via administration of HFD with no obesity. This HFD was used in two formulas, i.e one made from sunflower oil and cholesterol via gavage and another ad libitum HFD which mainly consisted of sunflower oil, palm oil shortening, hydrogenated vegetable oil, cholesterol, and other ingredients [18].
In our study, SG showed a significant reduction in body weight, AST, and ALT levels after 12 weeks post-surgery evaluation. There was no significant improvement in NASH scoring and grading but the photomicrograph of the rats’ liver showed mild ballooning, less steatosis, and inflammation post SG. In parallel with our finding, Azulai et al. (2021) showed that SG could significantly decrease ALT levels [19]. Bower et al. (2015) demonstrated the reduced effects of bariatric surgery on the levels of AST and ALT in human studies [20]. The GGT levels in all groups did not increase following NASH induction. This is parallel to the results of Schindhelm et al. (2007) which show that GGT levels are even within the “normal” range in NAFLD patients [21].
The current study showed that treatment with SG could significantly improve TG, TC, and LDL-C levels when compared to the C group. However, it was not effective on the above lipid profiles when compared with the SS group. Similar results were seen in the study of Talavera-Urquijo et al. (2018) in an assessment of the effects of SG on an animal model of NAFLD. They showed that SG could not improve TC, HDL, triglycerides levels following SG after 6 weeks when compared to sham surgery group [22]. Ricci et al. (2015) in a meta-analysis on 22 studies (n=4160) showed a decrease in the prevalence of hyperlipidemia of about 67% after 2-5 years post-surgery follow-up [23]. The inconsistent results in our study with other studies may be due to shorter follow up duration post-surgery.
Although our findings showed the attenuation of TNF-α and IL-1β following SG when compared to the C group, it was not significant when compared to the SS group. Furthermore, SG could not improve hepatic antioxidant capacity compared with the SS group at 12 weeks post- surgery follow up. Studies on the concentrations of inflammatory cytokines/markers following bariatric surgery have been contradictory. Whenever several studies have revealed reductions in the levels of these inflammatory markers following bariatric surgery, others have stated no such diminution [24]. The multiple factors influencing the inconsistences observed across the studies include the limited study sizes, study design/laboratory techniques, inherent differences in study populations, and timing of evaluation of postoperative outcomes etc.
The results of rats’ histology in the SG group revealed that bariatric surgery could not improve liver histology, NAS scores, including scores of steatosis, ballooning, and inflammation when compared to the SS group within 12 weeks after SG. However, there was an improvement in the steatosis in the liver photomicrographs in the SG group as compared to the control C group. Our results on histological evaluation were different with other human studies [25, 26] that showed a beneficial effect of SG on liver histology in NAFLD patients. Although the exact mechanism is unknown, one potential mechanism for the lack of improvement of hepatic histology in rats could be due to metabolic stress following rapid weight loss in the SG group, leading to hepatocellular injury [9]. Rapid weight loss may exaggerate releasing free fatty acid from visceral adipose tissue and overwhelm the liver parenchyma [9, 27]. Then, the hepatocytes oxidize free fatty acid and produce reactive oxygen species which could enhance the injury of mitochondrial and release of cytokines such as necrosis factor-α (TNF-α) [28], a biomarker in the pathogenesis of NASH [29]. The short postoperative study as compared to long post-surgery evaluations may be another reason why SG did not show a beneficial effect on the rats’ liver histology [9, 20] as seen in our study of 12 weeks post-SG.
Previous studies showed a high prevalence of NASH in obese patients [30]. Weight reduction is the primary treatment of NASH which includes the improvement of the liver enzyme levels, liver histology, and suspended progress of the disease [31]. In our study, the rats had a remarkable weight loss following SG (-16.5%; p<0.001) (Figure 2). This is parallel with decreasing food intake in the SG group. The reduction of rats’ food intake in the SG group could be due to the edema and inflammation of the gastric tissue suture line in the SG group. However, rats in the SG group adapted to their meal pattern with meal volume reduction and increased the frequency of the meals received [32]. The weight reduction in the SS group could most probably be due to post-surgery energy expenditure and surgical stress.
Some studies showed that the weight reduction following SG was related to food restriction [33, 34] which could be due to a reduction in the gastric volume and the levels of ghrelin [33]. Due to externalizing the main part of the gastric fundus through SG, the levels of ghrelin decrease and this could reduce appetite and consequently food intake [34, 35]. Some studies revealed SG could reduce the levels of peptide YY (PYY) and glucagon-like peptide-1 (GLP-1) which could decrease food intake due to suppression of appetite [36]. Furthermore, Kral et al. (2004) showed bariatric surgery could decrease levels of leptin leading to attenuation of inflammation and fatty infiltration and ultimately improvement of insulin sensitivity, one of the factors involved in NASH pathogenesis [37]. Ryan et al. (2014) in a study on transgenic rodents indicated that SG could significantly change circulated bile acid. They also showed changes in gut microbial communities following SG effecting on weight regulation and glucose tolerance. Taken together, these findings strongly support the assumption that SG is not only a restriction procedure but also metabolic [38]. We designed this animal study protocol with no post-SG mortality. There are a few limitations in our study. First, the results of our study were obtained from a rodent model which anatomically did not completely match with humans. Second, all rats had free access to a standard diet and sugary water. Therefore, the rate and amount of the food intake in these rats were not equal. Finally, as this is only a 12-week post SG study, there was no significant liver histology changes documented in these NASH induced rats.
5. Conclusion
A 12-week high fat-diet of sunflower oil was significant to induce NASH in sprague-dawley rats. At 12 weeks post SG, there was significant weight loss and liver function improvement (ALT and AST levels) in the NASH-induced sprague-dawley rat model with no improvement in serum levels of lipid profile (HDL-C, LDL-C, TG, and TC), inflammatory factors (h-CRP, TNF-α, and IL-1β) and hepatic antioxidant capacity (GSH, CAT, SOD, and GPx). Amelioration of the liver histology was not seen during this short study period. However, there was an improvement in the steatosis in the liver photomicrographs in the SG group as compared to the C group. A longer-term study is warranted to confirm the benefits of SG in liver histology and other clinical risk factors.
Acknowledgments
We would like to thank all the staff in Research and Technology of Lorestan University of Medical Sciences (LUMS), Iran for their support to conduct this study. The outcomes represented in this article were a section of the PhD thesis of Abolfathi Mohammad.
Conflicts of Interest
None.
Funding
This work was supported by Putra Grant (IPS) from Universiti Putra Malaysia GP-IPS/2019/9681800.
Author Contributions
Abolfathi Mohammad, Ebrahim Falahi, Afshin Nazari, Mohsen Gheitasvand, Mahtab Zynivand, and Omid Ali Adeli performed the research. Abolfathi Mohammad, Zubaidah Nor Hanipah, Barakatun-Nisak Mohd-Yusof, Mohd Redzwan Sabran, and Loqman Mohamad Yusof designed the research study. Abolfathi Mohammad, Barakatun-Nisak Mohd-Yusof, and Zubaidah Nor Hanipah analyzed the data. Abolfathi Mohammad wrote the paper and Zubaidah Nor Hanipah approved the final version of manuscript.
REFERENCES
[1] Zobair M Younossi, Aaron B Koenig,
Dinan Abdelatif, et al. “Global epidemiology of
nonalcoholic fatty liver disease-meta-analytic assessment of prevalence,
incidence, and outcomes.” Hepatology, vol. 64,
no. 1, pp. 73-84, 2016. View at: Publisher
Site | PubMed
[2] Zobair M Younossi, Rohit Loomba,
Quentin M Anstee, et al. “Diagnostic modalities for nonalcoholic fatty liver
disease, nonalcoholic steatohepatitis, and associated fibrosis.” Hepatology,
vol. 68, no. 1, pp. 349-360, 2018. View at: Publisher Site | PubMed
[3] Stephen A Harrison, Samer Gawrieh,
Katharine Roberts, et al. “Prospective evaluation of the prevalence of
non-alcoholic fatty liver disease and steatohepatitis in a large middle-aged US
cohort.” J Hepatol, vol. 75, no. 2, pp. 284-291, 2021. View at: Publisher Site | PubMed
[4] Kenneth Cusi, Scott Isaacs, Diana
Barb, et al. “American Association of Clinical Endocrinology clinical practice
guideline for the diagnosis and management of nonalcoholic fatty liver disease
in primary care and endocrinology clinical settings: co-sponsored by the American
Association for the Study of Liver Diseases (AASLD).” Endocrine Practice,
vol. 28, no. 5, pp. 528-562, 2022. View at: Publisher Site | PubMed
[5] William N Hannah Jr, Stephen A
Harrison “Lifestyle and dietary interventions in the management of nonalcoholic
fatty liver disease.” Dig Dis Sci, vol. 61, no. 5, pp. 1365-1374, 2016.
View at: Publisher
Site | PubMed
[6] European Association for the Study of
the Liver (EASL), European Association for the Study of Diabetes (EASD),
European Association for the Study of Obesity (EASO) “EASL-EASD-EASO Clinical
Practice Guidelines for the management of non-alcoholic fatty liver disease.” J
Hepatol, vol. 64, no. 6, pp. 1388-1402, 2016. View at: Publisher Site | PubMed
[7] Violeta B Popov, Joseph K Lim
“Treatment of nonalcoholic fatty liver disease: the role of medical, surgical,
and endoscopic weight loss.” J Clin Transl Hepatol, vol 3, no. 3, pp.
230-238, 2015. View at: Publisher
Site | PubMed
[8] Maria Catalina Hernandez-Rodas,
Rodrigo Valenzuela, Luis A Videla “Relevant aspects of nutritional and dietary
interventions in non-alcoholic fatty liver disease.” Int J Mol Sci, vol.
16, no. 10, pp. 25168-25198, 2015. View at: Publisher Site | PubMed
[9] Samer G Mattar, Laura M Velcu,
Mordechai Rabinovitz, et al. “Surgically-induced weight loss significantly
improves nonalcoholic fatty liver disease and the metabolic syndrome.” Ann
Surg, vol. 242, no. 4, pp. 610-617, 2005. View at: Publisher
Site | PubMed
[10] Bing He, Dongxu Piao, Chong Yu, et
al. “Amelioration in hepatic insulin sensitivity by reduced hepatic lipid
accumulation at short-term after Roux-en-Y gastric bypass surgery in type 2
diabetic rats.” Obes Surg, vol. 23, no. 12, pp. 2033-2041, 2013. View
at: Publisher Site | PubMed
[11] David E Kleiner, Elizabeth M Brunt,
Mark Van Natta, et al. “Design and validation of a histological scoring system
for nonalcoholic fatty liver disease.” Hepatology, vol. 41, no. 6, pp.
1313-1321, 2005. View at: Publisher
Site | PubMed
[12] Thing-Fong Tzeng, Shorong-Shii Liou,
Chia Ju Chang, et al. “[6]-Gingerol dampens hepatic steatosis and inflammation
in experimental nonalcoholic steatohepatitis.” Phytomedicine, vol. 22,
no. 4, pp. 452-461, 2015. View at: Publisher Site | PubMed
[13] Maryam Mashmoul, Azrina Azlan,
Norhafizah Mohtarrudin, et al. “Protective effects of saffron extract andcrocin
supplementation on fatty liver tissue of high-fat diet-induced obese rats.” BMC
Complement Altern Med, vol. 16, no. 1, pp. 401, 2016. View at: Publisher Site | PubMed
[14] Saraswoti Khadge, John Graham Sharp,
Geoffrey M Thiele, et al. “Dietary omega-3 and omega-6 polyunsaturated fatty
acids modulate hepatic pathology.” J Nutr Biochem, vol. 52, pp.
92-102, 2018. View at: Publisher
Site | PubMed
[15] Abeba Haile Mariamenatu, Emebet
Mohammed Abdu “Overconsumption of Omega-6 Polyunsaturated Fatty Acids (PUFAs)
versus Deficiency of Omega-3 PUFAs in Modern-Day Diets: The Disturbing Factor
for Their "Balanced Antagonistic Metabolic Functions" in the Human
Body.” J Lipids, vol. 2021, pp. 8848161, 2021. View at: Publisher Site | PubMed
[16] Kamila P Liput, Adam Lepczyński, Magdalena Ogłuszka, et al. “Effects of Dietary n-3 and n-6
Polyunsaturated Fatty Acids in Inflammation and Cancerogenesis.” Int J Mol Sci, vol. 22, no.
13, pp. 6965, 2021. View at: Publisher
Site | PubMed
[17] Yuhong Zou 1, Jun Li, Chao Lu, et al.
“High-fat emulsion-induced rat model of nonalcoholic steatohepatitis.” Life
Sci, vol. 79, no. 11, pp. 1100-1107, 2006. View at: Publisher Site | PubMed
[18] Leyla Yahaghi, Azadeh Ebrahim-Habibi,
Nasim Hayati-Roodbari, et al. “A simple method for inducing non-alcoholic
steatohepatitis with fibrosis.” Animal Model Exp Med, vol. 2, no. 4, pp.
282-290, 2019. View at: Publisher
Site | PubMed
[19] Shira Azulai, Ronit Grinbaum, Nahum
Beglaibter, et al. “Bariatric Surgery Affects Plasma Levels of Alanine
Aminotransferase Independent of Weight Loss: A Registry-Based Study.” J Clin
Med, vol. 10, no. 12, pp. 2724, 2021. View at: Publisher Site | PubMed
[20] Guy Bower, Tania Toma, Leanne
Harling, et al. “Bariatric Surgery and Non-Alcoholic Fatty Liver Disease: a
Systematic Review of Liver Biochemistry and Histology.” Obes Surg, vol.
25, no. 12, pp. 2280-2289, 2015. View at: Publisher Site | PubMed
[21]
Roger
K Schindhelm, Jacqueline M Dekker, Giel Nijpels, et al. “Alanine
aminotransferase predicts coronary heart disease events: A 10-year follow-up of
the Hoorn Study.” Atherosclerosis, vol. 191, no. 2, pp. 391-396,
2007. View at: Publisher
Site | PubMed
[22] Eider Talavera-Urquijo, Sarai
Rodríguez-Navarro, Marc Beisani, et al. “Morphofunctional Changes After Sleeve
Gastrectomy and Very Low Calorie Diet in an Animal Model of Non-Alcoholic Fatty
Liver Disease.” Obes Surg, vol. 28, no. 1, pp. 142-151, 2018. View at: Publisher Site | PubMed
[23] Cristian Ricci, Maddalena Gaeta,
Emanuele Rausa,. “Long-term effects of bariatric surgery on type II diabetes,
hypertension and hyperlipidemia: a meta-analysis and meta-regression study with
5-year follow-up.” Obes Surg, vol. 25, no. 3, pp. 397-405, 2015. View
at: Publisher Site | PubMed
[24] Fatimo Biobaku, Husam Ghanim, Scott V
Monte, et al. “Bariatric Surgery: Remission of Inflammation, Cardiometabolic
Benefits, and Common Adverse Effects.” J Endocr Soc, vol. 4, no.
9, pp. bvaa049, 2020. View at: Publisher
Site | PubMed
[25] John B Dixon, Prithi S Bhathal, Paul
E O'Brien “Weight loss and non-alcoholic fatty liver disease: falls in
gamma-glutamyl transferase concentrations are associated with histologic
improvement.” Obes Surg, vol. 16, no. 10, pp. 1278-1286, 2006. View at: Publisher Site | PubMed
[26] Maria Antonella Burza, Stefano Romeo,
Anna Kotronen, et al. “Long-term effect of bariatric surgery on liver enzymes
in the Swedish Obese Subjects (SOS) study.” PLoS One, vol. 8, no. 3, pp.
e60495, 2013. View at: Publisher
Site | PubMed
[27] Elizabeth C Verna, Paul D Berk “Role
of fatty acids in the pathogenesis of obesity and fatty liver: impact of
bariatric surgery.” Semin Liver Dis, vol. 28, no. 4, pp. 407-426, 2008. View
at: Publisher Site | PubMed
[28] Timea Csak, Michal Ganz, Justin
Pespisa, et al. “Fatty acid and endotoxin activate inflammasomes in mouse
hepatocytes that release danger signals to stimulate immune cells.” Hepatology,
vol. 54, no. 1, pp. 133-144, 2011. View at: Publisher Site | PubMed
[29] Veeral Ajmera, Emily R Perito, Nathan
M Bass, et al. “NASH Clinical Research Network Novel plasma biomarkers
associated with liver disease severity in adults with nonalcoholic fatty liver
disease.” Hepatology, vol. 65, no. 1, pp. 65-77, 2017. View at: Publisher Site | PubMed
[30] Dongsheng Cai, Minsheng Yuan, Daniel
F Frantz, et al. “Local and systemic insulin resistance resulting from hepatic
activation of IKK-beta and NF-kappaB.” Nat Med, vol. 11, no. 2,
pp. 183-190, 2005. View at: Publisher
Site | PubMed
[31] Sumio Watanabe, Etsuko Hashimoto,
Kenichi Ikejima, et al. “Evidence-based clinical practice guidelines for
nonalcoholic fatty liver disease/nonalcoholic steatohepatitis.” J
Gastroenterol, vol. 50, no. 4, pp. 364-377, 2015. View at: Publisher Site | PubMed
[32] Margaret A Stefater, Diego
Pérez-Tilve, Adam P Chambers, et al. “Sleeve gastrectomy induces loss of weight
and fat mass in obese rats, but does not affect leptin sensitivity.” Gastroenterology,
vol. 138, no. 7, pp. 2426-2436, 2010. View at: Publisher Site | PubMed
[33] João de Bona Castelan, Jane Bettiol,
Armando José d'Acampora, et al. “Sleeve gastrectomy model in Wistar rats.” Obes
Surg, vol. 17, no. 7, pp. 957-961, 2007. View at: Publisher Site | PubMed
[34] F B Langer, M A Reza Hoda, A
Bohdjalian, et al. “Sleeve gastrectomy and gastric banding: effects on plasma
ghrelin levels.” Obes Surg, vol. 15, no. 7, pp. 1024-1029, 2005. View
at: Publisher Site | PubMed
[35] Régis Cohen, Bernard Uzzan, Hélène
Bihan, et al. “Ghrelin levels and sleeve gastrectomy in super-super-obesity.” Obes
Surg, vol. 15, no. 10, pp. 1501-1502, 2005. View at: Publisher Site | PubMed
[36] Ralph Peterli, Bettina Wölnerhanssen,
Thomas Peters, et al. “Improvement in glucose metabolism after bariatric
surgery: comparison of laparoscopic Roux-en-Y gastric bypass and laparoscopic
sleeve gastrectomy: a prospective randomized trial.” Ann Surg, vol. 250,
no. 2, pp. 234-241, 2009. View at: Publisher Site | PubMed
[37] John G Kral, Swan N Thung, Simon Biron, et al. “Effects of surgical treatment of the metabolic syndrome on liver fibrosis and cirrhosis.” Surgery, vol. 135, no. 1, pp. 48-58, 2004. View at: Publisher Site | PubMed
[38] Karen K Ryan, Valentina Tremaroli 2, Christoffer Clemmensen, et al. “FXR is a molecular target for the effects of vertical sleeve gastrectomy.” Nature, vol. 509, no. 7499, pp. 183-188, 2014. View at: Publisher Site | PubMed