Received: Mon 24, Jun 2024
Accepted: Tue 16, Jul 2024
Abstract
Background: The great value concealed in the sequence of coronary angiography frames for diagnosis is not discovered in the world. Current approaches for auto-diagnosis are frame-based.
Objectives: We aimed to demonstrate the “Sequence Value” concealed in the coronary angiography and answer how to realize the sequence value using an unsupervised language model to indicate CABG.
Methods: We first applied the theory of CMT ad ATOM to develop the theory of our proposed unsupervised language model. Then we designed an experiment to demonstrate the effectiveness of sequence value (sequence recovery capability) to indicate coronary artery lesions. Last, we developed an unsupervised language model to take use of the sequence value and indicate CABG.
Results: For the experiment, the AUC of SYNTAX>0 reaches 92 from physicians. For the unsupervised language model DZL, the average AUC of CABG indicator (SYNTAX>=23) reaches 80.08 for the five-folder validation. The model (DZL) is based on the unsupervised language model. It could be completed within 30 seconds and is robust to static data noise.
Conclusion: We discovered and demonstrated the “Sequence Value” concealed in coronary angiography video. It could be used as an indicator to CABG. We creatively developed an unsupervised language model to indicate CABG by taking use of the “Sequence Value” in an efficient and robust manner.
Keywords
Sequence Value, coronary angiography, SYNTAX score, myocardial ischemia, unsupervised language model, CABG
1. Introduction
Coronary angiography exhibits in a video form, consisting of several images in a predefined sequence. In terms of automatic diagnosis studies focusing on coronary angiography, seems there is yet no trend to make diagnosis based on the whole video. Instead, existing researches get used to “quote out of the context”: the auto-diagnosis is made condition on separate image selected from the video [1-4]. However, the ignorance of the information concealed in the whole video has shown its disadvantages, disability and out of style especially when we are standing on the milestone of AI and its famous descendant: large language model [5]. It is the AI era never as emphasizing context and sequence as before. We termed the logic behind these models as “given context what’s next”. Back to coronary angiography, whether we could transplant such concept by interpreting each image to a language unit and many images to a whole sentence? Also whether such video “sentence” conveyed affluent diagnosis information? It’s like “given video what’s wrong” logic. Our study aimed to answer these two questions.
A video is vividly releasing us some information as a sentence conveying messages ready to be interpreted by human. In such perspective, it is never wise to tell from a word instead of a sentence. To the best of our knowledge, auto-diagnosis studies haven’t embarked on this new chapter yet. Some diagnoses take use of morphology [1]. Some diagnoses are based on expert system [2]. Some diagnoses apply operation research algorithm [3] and some diagnoses enter the AI high speed road [4]. All these works require a good qualified frame be selected from the video and thus is frame-based. Here we used a language model to handle coronary angiography video-based diagnosis and achieved pronounced results.
The encoder decoder sequential model [6, 7] is usually used in nature language processing. Here we creatively applied it using coronary angiography as the input. The idea is reasonable in 3 folds. First, video is a kind of sequential information consisting of the image as atom. If a sentence is constituted by words, then a video is constituted by images. Second, the hidden size of the language model is usually determined by the word embedding dimensions. While for image, its various pixels become the corresponding extra dimension. We set the hidden size of our model as 5000 to be parallelly processed. We inferred in section 4.3 that the larger the hidden size was, the better the performance we got. The paralleled capability of our model depends on the GPU quantity and memory. Third, the information each image conveys are not independent, they are mutual related [8]. Given the previous images could gain the probability to predict next image. Such intrinsic logic is quite similar to build a language model. The above reasons root in our model specifications and lay a foundation for the effectiveness of the model to make diagnosis.
2. Methods
2.1. Theoretical Background
Coronary angiography (CAG) is exhibited in a form of videos, which record the dynamic process of contrast agent flowing in the blood vessel. The part that is unable to be developed by contrast agent is the location of suspected lesions [9, 10]. The opacification process, in a human visual perspective, is a temporal and spatial integrative movement. The antegrade contrast material moves forward within a specified time window. The spatial movement alone is not sufficient to represent since the antegrade contrast material should enter or clear (or both) with predefined speed [7]. There are two branches of theoretical arguments in terms of how human brains process temporal and spatial information: CMT (conceptual metaphor theory) vs. ATOM (a theory of magnitudes). CMT is proposed by Lakoff and Johnson [11] which assumes that the neural system characterizing concrete sensorimotor experience has more inferential connections and therefore a greater inferential capacity than the neural system characterizing abstract thoughts [12]. The abstract expression of time is thus dominated by the concrete expression of space, forming an asymmetric hypothesis. Time can be expressed by space more than space expressed by time [13].
The ATOM is proposed by Walsh [14] proposing hypothesis that time and space information are processed physically activating the overlapped area of the brain (parietal cortex), which indicates that there exists a unified magnitude for humans to process information in these two separating domains. Thus, ATOM is featured as the symmetric hypothesis, temporal and spatial information weight equally and can be exchangeable as the processing output signal to activate further action [14]. Whichever theory we choose to build on, it supports the argument that time can be represented by space. This is the foundation rooted on our novel method to measure temporal and spatial coupling tightness (TSCT). For videos with high temporal and spatial coupled tightness, if we shuffle the time factor, it will thus rearrange the antegrade contrast agent spatially. The disordered time will cause spatial incoherency of opacification process and such incoherency, if reaches some extent, is possible to be observed by humans visually.
On the contrary, if the shuffled time brings no obvious spatial incoherency, and humans are not able to distinguish the shuffled frames, let alone to recover the sequence. Hence the sequence recovery capability of the shuffled frames could be an indicator of the coupling extent between time and space. As the existence of the lesion will hinder the opacification process more or less [15], leading to the decrease of TSCT, it is reasonable to use TSCT as an indicator of coronary artery disease. Consequently, we make link between sequence recovery capability and coronary artery disease.
2.2. Outcome Measure
In this study, we used the SYNTAX score as an indicator to CABG as the outcome measure according to “2018 ESC/EACTS Guidelines on myocardial revascularization” [16] that patients with SYNTAX score ≥ 23 are suggested to conduct CABG. We verified the relationship between sequence recovery capability and SYNTAX Score in two folds: An experiment & an unsupervised language model.
2.3. An Experiment Indicating the Equivalence between Sequence Recovery Capability and Syntax Score
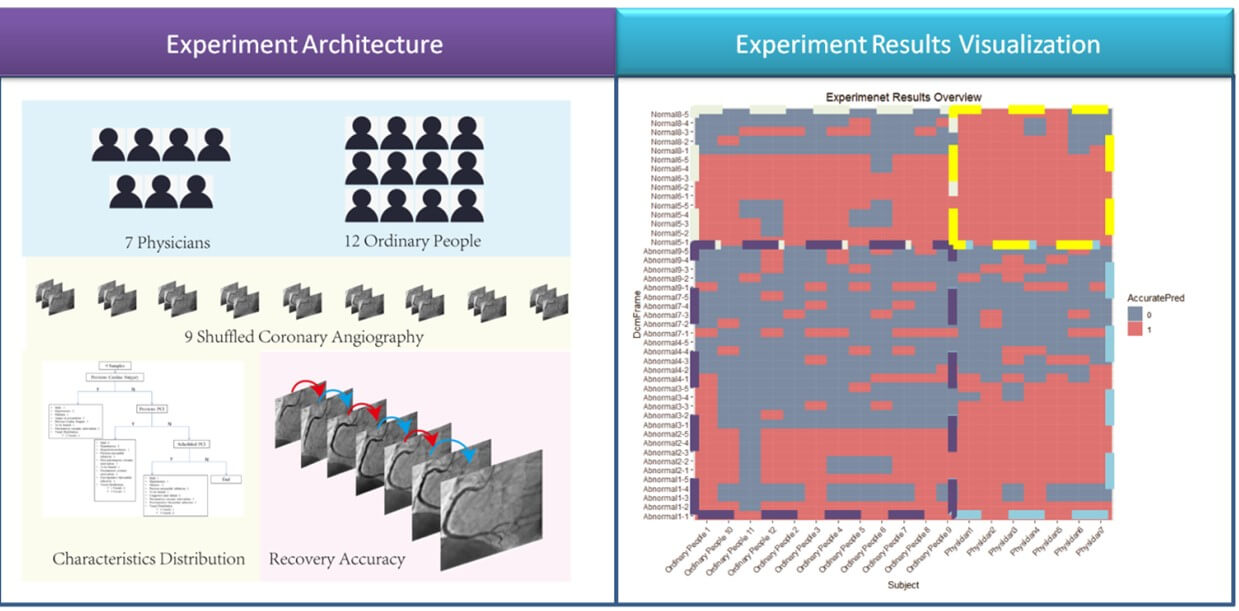
We implemented an experiment to validate that the sequence recovery capability is an indicator of syntax score. The experiment design architecture was illustrated in (Figure 1). 7 cardiology physicians and 12 ordinary people participated in this experiment. A questionnaire was designed and sent to each of them. The questionnaire sample was attached in (Supplementary Material Section 4). All the subjects were asked to recover 9 time-shuffled coronary angiographies. We asked the 19 subjects to complete their answers of sequence recovery in 10 minutes independently. We used Cohen's kappa [17] to measure the agreement between the true sequence and the subjects’ predictions, the detailed results were illustrated in (Section 3.1).
2.4. An Unsupervised Language Model to Recover Sequence without Labeling
2.4.1. Data Screening
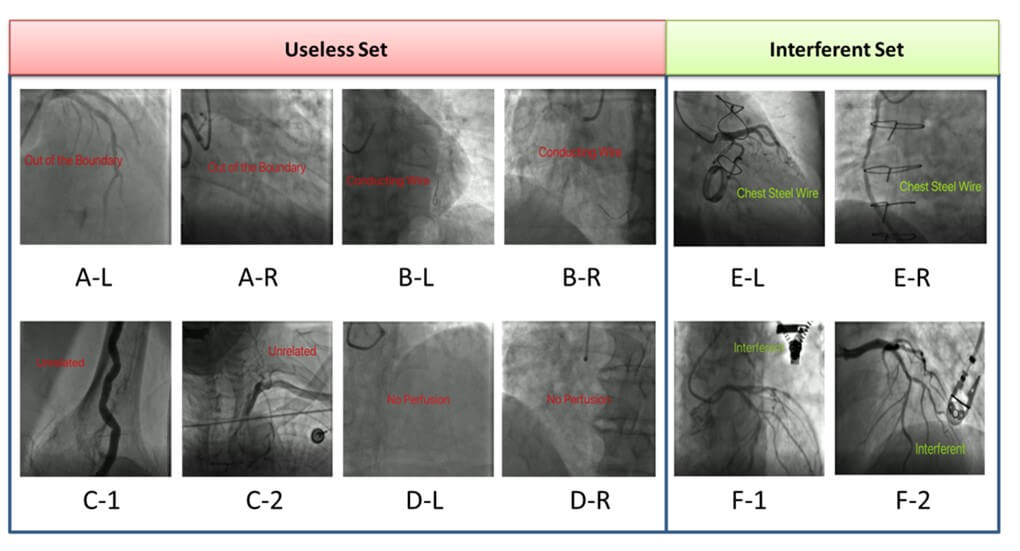
From January 1st, 2016, to September 30th, 2016, we collected 4458 unidentified coronary angiographies videos from 353 inpatient patients. We defined an “Interferent Set” for videos including some static interferent as illustrated in (Figure 2). There are 115 videos in “Interferent Set”. We defined a “Useless Set” for videos of low quality as illustrated in (Figure 2). We excluded “Useless Set” as they are meaningless. There are 2522 videos in “Useless Set”. But we included “Interferent Set” so as to demonstrate that DZL is robust to such static data noise.
We got 746 RCA and 1190 LCA videos remaining. We randomly divided the 353 patients into 5 groups. We alternatively assigned 1 group as the test set and the other 4 groups as the training set. 5-folder validation was then done in turn.
2.4.2. The Model
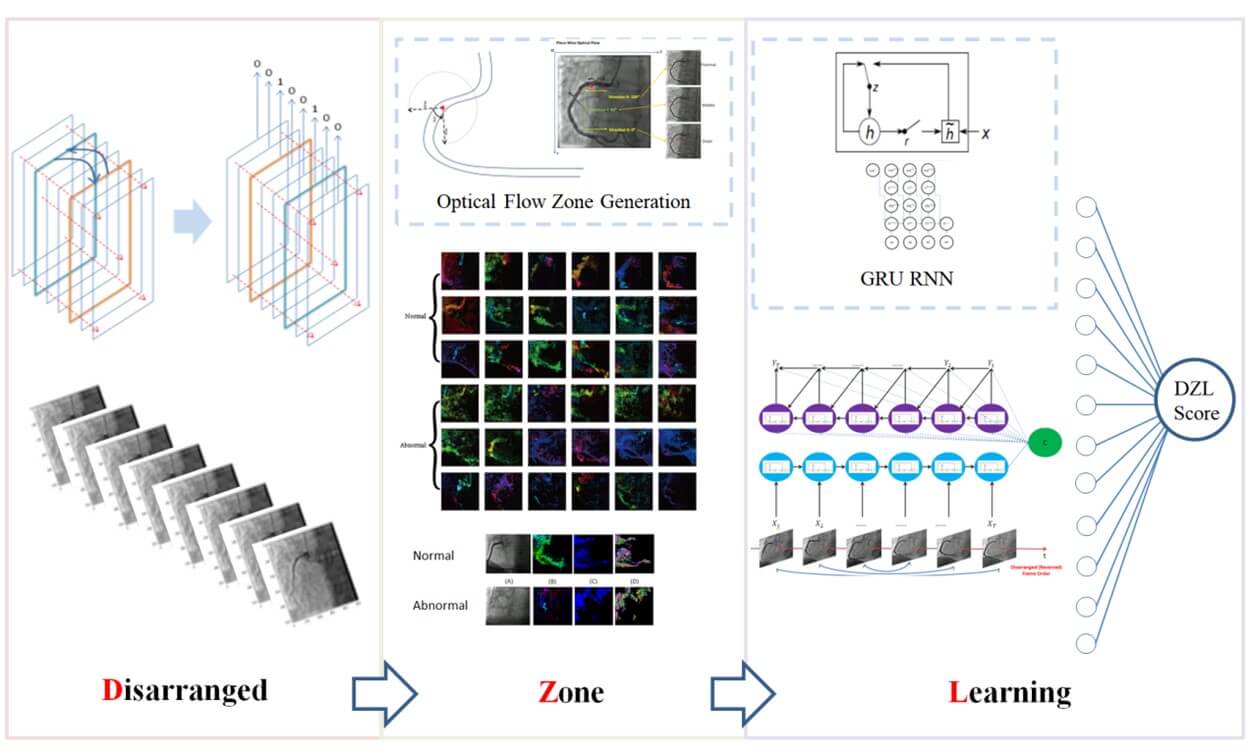
Based on the novel method and its effectiveness, we designed and implemented an unsupervised language model to learn the capability to recover the shuffled sequence of coronary angiography. according to Sutskever [6], we shuffled the frames in a reversed order (video rewinding) and the unsupervised language model worked to recognize the true order. The model framework was illustrated in (Supplementary Figure 5). The encoder was iterated in image level, each input was the optical flow value of pixels on the image. Through a GRU that generated its output and the hidden layer. The current hidden layer then acted as part of the next input. The decoder worked image by image. Given the encoder fixed context vector and the current target, bypassing a GRU to predict the next target.
The loss of the model was the MSE between the true vertical coordinate sequence of the optical flow and the predicted. It was used as a measurement of sequence recovery capability. The details of the language model were given in (Appendix Section 2). The unsupervised language model was termed disarranged zone learning (DZL). The overall framework of DZL was illustrated in (Figure 3).
3. Results
3.1. The Experiment
The Cohen kappa matrix between subjects’ predictions and the true sequences were listed in (Table 1) and visualized in (Figure 1). From the results, the agreement between predictions and the true sequence was higher in “normal” than “abnormal” no matter the subject was physician or ordinary people. Besides, physicians’ prediction agreements were overall higher than ordinary people in both groups as physicians have affluent clinical experience and practice to make diagnosis from the coronary angiography. Also notice that even for experienced physicians, the shuffled frames of abnormal cases were not easy to be recovered. The Cohen kappa was only 0.48. Let alone for ordinary people, the Cohen kappa was merely 0.25. However, it is much easier for physicians to recover the shuffled frames of normal cases. The Cohen kappa reached 0.89. Even for ordinary people without any medical experience, the Cohen kappa reached 0.56. Despite that 0.56 did not indicate high prediction capability, it was enough to gain the advantage over the ordinary people’s capability to predict the abnormal case (Cohen kappa 0.25). Consequently, it was the relative distance between abnormal and normal cases counted instead of the absolute value. The detailed confusion matrixes of physicians and ordinary people were given in (Supplementary Material Section 4). The AUC of RCA achieved in the experiment from 7 professional physicians is 92.
Table. 1. Cohen kappa
matrix between subjects’ predictions and true sequence.
|
Physicians |
Ordinary
People |
|
|
Abnormal |
0.48 |
0.25 |
|
Normal |
0.89 |
0.56 |
|
|
Physicians |
|
|
Area
Under the Curve (AUC) |
92 |
|
3.2. Automation Model
3.2.1. Non-Invasive
DZL is a software based model. The input of the model is a whole coronary angiography video. The output of the algorithm is a DZL score indicating the sequence recovery capability. It is non-invasive. We verified the performance of DZL in indicating CABG (SYNTAX Score >=23). The main results were listed in (Table 2). The average AUC of the five-folder validation was 80.08 for CABG indicator (SYNTAX>=23).
Table. 2. Main performance
results (Hidden Size = 5000).
|
SYNTAX>=23 |
|||
|
Group 1 |
Group 2 |
Group 3 |
|
|
AUC-median--%(95% CI) |
82.129(70.312-91.216) |
89.16(76.953-98.438) |
78.893(67.128-89.451) |
|
Sensitivity -- %(95%CI) |
100.0(75.0-100.0) |
100.0(100.0-100.0) |
100.0(85.294-100.0) |
|
Specificity -- %(95%CI) |
68.75(46.875-90.625) |
87.5(75.0-96.875) |
64.706(47.059-82.353) |
|
Positive predictive value -- %(95%CI) |
74.419(65.306-88.889) |
88.889(80.0-96.97) |
73.913(65.385-82.937) |
|
Negative predictive value -- %(95%CI) |
100.0(75.0-100.0) |
100.0(100.0-100.0) |
100.0(83.321-100.0) |
|
Group4 |
Group5 |
||
|
AUC-median--%(95% CI) |
70.222(55.331-82.222) |
80.017(67.904-90.052) |
|
|
Sensitivity -- %(95%CI) |
56.667(40.0-100.0) |
76.471(58.824-91.176) |
|
|
Specificity -- %(95%CI) |
93.333(33.333-100.0) |
88.235(73.529-97.059) |
|
|
Positive predictive value -- %(95%CI) |
89.474(60.0-100.0) |
86.207(74.194-96.552) |
|
|
Negative predictive value -- %(95%CI) |
68.182(60.417-100.0) |
78.049(68.182-90.909) |
|
|
5 Groups AUC Mean |
80.084 |
||
* Note: The blank cells
stand for data not available. AUC: Area Under the Curve. SYNTAX: Synergy
between percutaneous coronary intervention (PCI) with taxus and cardiac surgery.
Bootstrapping was used to estimate 95% confidence intervals (CI) for the
performance metrics of our classification results (i.e., AUC, sensitivity,
specificity). We applied n-out of-n bootstrap with replacement from our
dataset. For each bootstrap sample, we calculated and reserved the performance
metrics for that bootstrap sample. The bootstrap sampling was repeated for 2000
times. We then estimated the 95% CI by using the 2.5 and 97.5 percentiles of
the empirical distribution of corresponding metrics. All the results retain 3
decimal places, unless the last decimal is 0.
3.2.2. Efficient
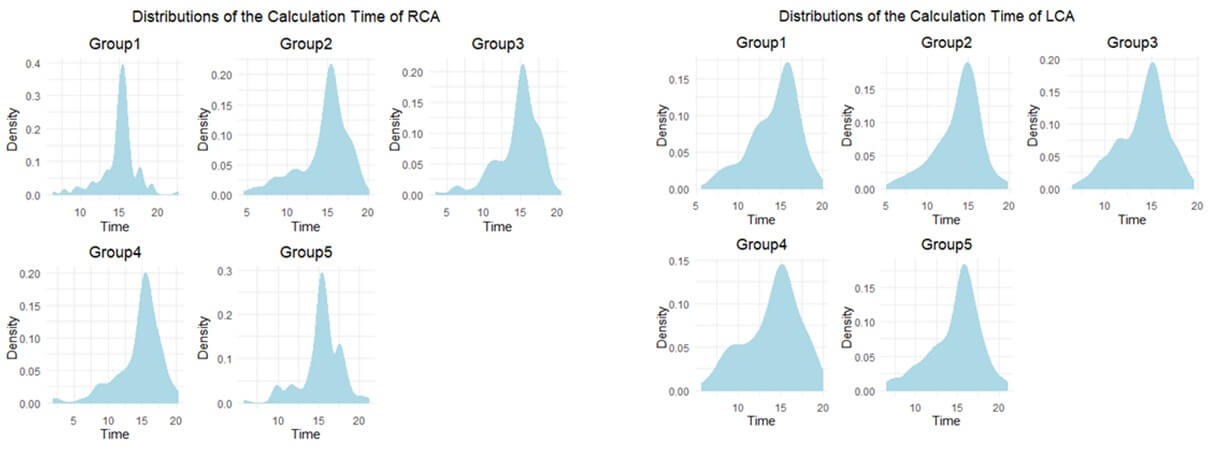
DZL is an Efficient algorithm. For example, existing QFR with reported median analysis time is 5 min in the FAVOR II Europe-Japan study [18]. However, DZL could be calculated within 30 seconds. The detailed calculation time distributions are listed in (Figure 4).
3.2.3. Robust
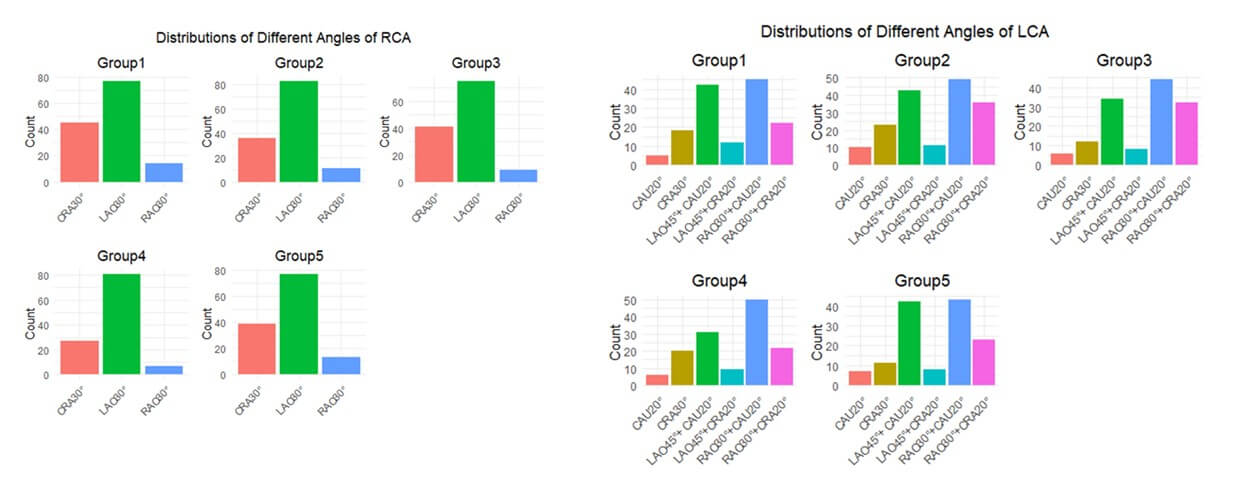
Importantly, flow could/frequently is different in the right coronary artery compared with the left (diastolic). However, we found DZL effective in both branches. We added the RCA DZL scores and LCA DZL scores together as the final DZL scores to evaluate each video. Furthermore, we also included “Interfered Set” in the training and testing process. Last but not least, we distinguished the RCA videos from 3 angles: a). LAO30°; b). CRA30°; c). RAO30° and we distinguished the LCA videos from 6 angles: a). CAU20°; b) RAO30°+CAU20°; c) LAO45°+CAU20°; d) CRA30°; e) RAO30°+CRA20°; f) LAO45°+CRA20°. The overall angle distributions of RCA and LCA in the 5 groups were illustrated in (Figure 5). Consequently, DZL was robust to different angiography angles as well.
4. Discussion
4.1. Dynamic Diagnosis Based on Coronary Angiography Video
As a typical example, Moon et al. (2021) [19] used CNN to achieve the automatic recognition of coronary lesion based on coronary angiography. However, the preprocessing technique of their method was to select key frames instead of utilizing the whole coronary angiography video. Besides, their method was a purely supervised learning which needs manual label efforts a lot. Our model was based on analysis of the whole coronary angiography video instead of separated images which was dynamic.
4.2. Label Free
There are many mature annotation libraries in image recognition, the most famous one is ImageNet [20], and there are some other annotation libraries in video recognition such as kinetics. These databases covered general scenarios. However, in the field of medical imaging, especially coronary angiography, there is no mature annotation library developed. For studies using deep learning techniques in this field, researchers need to complete the label engineering by themselves which is costly since the annotation must be finished by professional doctors [21-27]. This makes the development of deep learning, especially supervised learning in medical image field greatly limited.
According to statistics by May 2020 from OECD (Organization for Economic Cooperation and Development), the average annual income of a specialist in hospitals of United States is 350300 dollars, and for a GP is 242400 dollars. That is to say, a specialist earns up to $168 an hour and a GP earns up to $116 an hour, even without taking into account national holidays. Doctors estimated that it took about 10 to 15 minutes to fully evaluate a coronary angiography. If a junior GP is assigned to annotate a video, the cost is as high as $30 for each coronary angiography. In terms of deep learning, a lot of labeled angiographies are needed. For example, in this paper, 746 RCA angiographies and 1190 LCA angiographies were used, not to mention some larger dataset (Supplementary Figure 6).
4.3. Potential of DZL
We inferred that DZL still has great potential to be improved since the model used optical flow technology and an effective zone was generated to represent sequence feature between frames which was an idea of dimension reduction. The dimension of the model input was reduced by more than 50 times (We randomly selected 5000 points from the “Restricted Zone (5243 points)” from the 512*512 whole set (hidden size = 5000), (Supplementary Material Section 2)) while the performance of the model was maintained in a good level. Dimension reduction brought about the loss of information and abstraction of features, causing the AUC deteriorated. If we enhance the parallel computing power of computers, such as using GPU with larger memory or more quantity (current GPU setting: single NVIDIA GeForce RTX 3090-24G) to design and implement the model so as not to reduce the dimension too much, it could thus improve the AUC. To demonstrate such argument, we attached the final results (Table 3) of the model only randomly selecting 1500 points from the “Restricted Zone” from the 512*512 whole set (hidden size = 1500), the results deteriorated a lot as expected. Such counter-operation demonstrated on the other hand that the quantities of points selected were positively related with the final performance.
Table. 3. Results for
hidden size =1500.
|
SYNTAX>=23 |
|||
|
Group 1 |
Group 2 |
Group 3 |
|
|
AUC-median--%(95% CI) |
72.549(59.375-84.774) |
76.27(60.938-89.062) |
71.972(58.997-83.912) |
|
Sensitivity -- %(95%CI) |
75.0(46.875-87.5) |
100.0(100.0-100.0) |
73.529(47.059-100.0) |
|
Specificity -- %(95%CI) |
81.25(65.625-96.875) |
71.875(56.25-87.5) |
76.471(44.118-94.118) |
|
Positive predictive value -- %(95%CI) |
78.571(66.667-94.452) |
78.049(69.565-88.889) |
75.0(62.848-90.919) |
|
Negative predictive value -- %(95%CI) |
75.0(62.5-87.5) |
100.0(100.0-100.0) |
74.286(62.739-100.0) |
|
Group4 |
Group5 |
||
|
AUC-median--%(95% CI) |
62.167(47.219-75.45) |
71.886(57.872-83.824) |
|
|
Sensitivity -- %(95%CI) |
63.333(20.0-100.0) |
76.471(55.882-88.235) |
|
|
Specificity -- %(95%CI) |
76.667(23.333-100.0) |
82.353(70.588-94.118) |
|
|
Positive predictive value -- %(95%CI) |
70.833(56.604-100.0) |
80.645(70.0-92.857) |
|
|
Negative predictive value -- %(95%CI) |
66.667(55.556-100.0) |
76.923(65.704-87.879) |
|
|
5 Groups AUC Mean |
70.968 |
||
* Note: The blank cells
stand for data not available. AUC: Area Under the Curve. SYNTAX: Synergy
between percutaneous coronary intervention (PCI) with taxus and cardiac surgery.
Bootstrapping was used to estimate 95% confidence intervals (CI) for the
performance metrics of our classification results (i.e., AUC, sensitivity,
specificity). We applied n-out of-n bootstrap with replacement from our
dataset. For each bootstrap sample, we calculated and reserved the performance
metrics for that bootstrap sample. The bootstrap sampling was repeated for 2000
times. We then estimated the 95% CI by using the 2.5 and 97.5 percentiles of
the empirical distribution of corresponding metrics. All the results retain 3 decimal places, unless the last decimal
is 0.
5. Conclusion
The “Sequence Value” of coronary angiography is buried deep. It is just like a swift horse leading a program in coronary artery disease diagnosis. We proposed DZL as a CABG indictor in a non-invasive, efficient and robust manner. In our experiment, the AUC of SYNTAX>0 reached 92. The model AUC of the five-folder validation reached 80.08 for SYNTAX>=23 as an indicator to CABG. DZL worked in an efficient manner and could be conducted within 30 seconds. In a nutshell, DZL is promising to lead a revolution in evaluation of coronary artery disease and we would like to invite the world to dig the gold mine.
Limitations
The biggest limitation of DZL is that it is dysfunctional to distinguish further between the LAD and LCX performance separately. DZL is working on video level. LCA and RCA are physically separated into different videos. However, there is no physical video specifically recording LAD or LCX alone. Such video structure limits the separated calculation of LAD and LCX solely. Besides, DZL is not able to locate the exact position of the lesions, only the overall DZL scores are available for RCA and LCA respectively. Last, typical image-level preprocessing techniques of coronary angiography were not applied in this work as we wanted to test the pure power of DZL. Future work could gradually integrate the related procedures such as segmentations, centerline extractions etc. into the model.
Clinical Perspectives
Competency in Medical Knowledge
The discovery that “diagnosis of coronary artery disease can be made by shuffling sequence of coronary angiography video” is released. It is translated to an unsupervised language model termed disarranged zone learning to recover the shuffled sequence of coronary angiography video. The recovery accuracy is creatively used as an indicator to CABG.
Competency in Patient Care
Making diagnosis and indicate CABG in a non-invasive, efficient, robust manner.
Translational Outlook 1
Diagnosis of coronary artery disease can be made by using disarranged zone learning model. The model (algorithm) is software-based (non-invasive, efficient, robust) and can be embedded into many diagnosis tools.
Translational Outlook 2
The unsupervised language model is also applicable in medical realm. Further clinical study is called for. Its label-free feature can relieve heavy burden of medical labeling engineering.
Funding
The National Natural Science Foundation of China (Grant No. 82200554). Young Medical Talents Training Program of Pudong Health Bureau of Shanghai (Grant No. PWRq2023-16).
Conflicts of Interest
None.
Abbreviations
ATOM: A Theory of Magnitudes
AUC: Area Under the Curve
CAD: Coronary Artery Disease
CAG: Coronary Angiography
CABG: Coronary Artery Bypass Grafting
CAU: Caudal.
CCTA: Coronary Computed Tomography Angiography
CMR: Cardiac Magnetic Resonance
CMT: Conceptual Metaphor Theory
CRA: Cranial
CT: Computed Tomography
DZL: Disarranged Zone Learning
FFR: Fractional Flow Reserve
GPU: Graphic Processing Unit
GRU: Gated Recurrent Unit
LAO: Left Anterior Oblique
LCA: Left Coronary Artery
LV: Left Ventricle
PCI: Percutaneous Coronary Intervention
QFR: Quantitative Flow Ratio
RAO: Right Anterior Oblique
RCA: Right Coronary Artery
ROC: Receiver Operating Characteristic
RNN: Recurrent Neural Network
TIMI: Thrombolysis In Myocardial Infarction
TSCT: Temporal and Spatial Coupling Tightness
REFERENCES
[1] F Zana, J C Klein “Segmentation of
vessel-like patterns using mathematical morphology and curvature evaluation.” IEEE
Trans Image Process, vol. 10, no. 7, pp. 1010-1019, 2001. View at: Publisher Site | PubMed
[2] S A Stansfield “ANGY: A rule-based
expert system for automatic segmentation of coronary vessels from digital
subtracted angiograms.” IEEE Trans Pattern Anal Mach Intell, vol. 8, no.
2, pp. 188-199, 1986. View at: Publisher Site | PubMed
[3] Dwarikanath Mahapatra “Cardiac image
segmentation from cine cardiac MRI using graph cuts and shape priors.” J
Digit Imaging, vol. 26, no. 4, pp. 721-730, 2013. View at: Publisher Site | PubMed
[4] Majd Zreik, Robbert W van Hamersvelt,
Jelmer M Wolterink, et al. “A recurrent CNN for automatic detection and
classification of coronary artery plaque and stenosis in coronary CT
angiography.” IEEE Trans Med Imaging, vol. 38, no. 7, pp. 1588-1598,
2019. View at: Publisher
Site | PubMed
[5] Luigi De Angelis, Francesco Baglivo,
Guglielmo Arzilli, et al. “ChatGPT and the rise of large language models: the
new AI-driven infodemic threat in public health.” Front Public Health,
vol. 11, pp. 1166120, 2023. View at: Publisher Site | PubMed
[6] Ilya Sutskever, Oriol Vinyals, and
Quoc V. Le “Sequence to sequence learning with neural networks.” Proceedings
of the 27th International Conference on Neural Information Processing Systems,
vol. 2, pp. 3104-3112, 2014.
[7] Kyunghyun Cho, Bart van Merriënboer,
Caglar Gulcehre, et al. “Learning Phrase Representations using RNN
Encoder-Decoder for Statistical Machine Translation.” EMNLP, pp. 1724-1734, 2014View at: Publisher Site
[8] The TIMI Study Group “The
Thrombolysis in Myocardial Infarction (TIMI) Trial - Phase I Findings.” N
Engl J Med, vol. 312, no. 14, pp. 932-936, 1985. View at: Publisher Site | PubMed
[9] Lei Song, Shengxian Tu, Zhongwei Sun,
et al. “Quantitative flow ratio-guided strategy versus angiography-guided
strategy for percutaneous coronary intervention: Rationale and design of the
FAVOR III China trial.” Am Heart J, vol. 223, pp. 72-80, 2020. View at: Publisher Site | PubMed
[10] Julie M Miller, Carlos E Rochitte,
Marc Dewey, et al. “Diagnostic Performance of Coronary Angiography by 64-Row
CT.” N Engl J Med, vol. 359, no. 22, pp. 2324-2336, 2008. View at: Publisher Site | PubMed
[11] George Lakoff, Mark Johnson
:Conceptual metaphor in everyday language.” J Philos, vol. 77, pp.
453-486, 1980. View at: Publisher
Site
[12] L Boroditsky “Metaphoric structuring:
understanding time through spatial metaphors.” Cognition, vol. 75,no. 1,
pp. 1-28, 2000. View at: Publisher
Site | PubMed
[13] Jonna Loeffler, Rouwen Cañal-Bruland,
Anna Schroeger, et al. “Interrelations between temporal and spatial cognition:
The role of modality-specific processing.” Front Psychol, vol. 9, pp.
2609, 2018. View at: Publisher
Site | PubMed
[14] Vincent Walsh “A theory of magnitude:
common cortical metrics of time, space and quantity.” Trends Cogn Sci,
vol. 7, no. 11, pp. 483-488, 2003. View at: Publisher Site | PubMed
[15] M J Kern, J A Moore, F V Aguirre, et
al. “Determination of angiographic (TIMI grade) blood flow by intracoronary
doppler flow velocity during acute myocardial infarction.” Circulation,
vol. 94, no. 7, pp. 1545-1552, 1996. View at: Publisher Site | PubMed
[16] Franz-Josef Neumann, Miguel
Sousa-Uva, Anders Ahlsson, et al. “2018 ESC/EACTS Guidelines on myocardial
revascularization.” Eur Heart J, vol. 40, no. 2, pp. 87-165, 2019. View
at: Publisher Site | PubMed
[17] Jacob Cohen “A Coefficient of
agreement for nominal scales.” Educational and Psychological Measurement,
vol. 20, no. 1, 1960. View at: Publisher Site
[18] Bo Xu, Shengxian Tu, Lei Song, et al.
“Angiographic quantitative flow ratio-guided coronary intervention (FAVOR III
China): a multicenter, randomized, sham-controlled trial.” Lancet, vol.
398, no. 10317, pp. 2149-2159, 2021. View at: Publisher Site | PubMed
[19] Jong Hak Moon, Da Young Lee, Won Chul
Cha, et al. “Automatic stenosis recognition from coronary angiography using
convolutional neural networks.” Comput Methods Programs Biomed, vol.
198, pp. 105819. View at: Publisher
Site | PubMed
[20] Jia Deng, Wei Dong, Richard Socher,
et al. “Imagenet: A large-scale hierarchical image database.” 2009 IEEE
Conference on Computer Vision and Pattern Recognition. June 20th -
25th, 2009.
[21] Riccardo Miotto, Fei Wang, Shuang
Wang, et al. “Deep learning for healthcare: review, opportunities and
challenges.” Brief Bioinform, vol. 19, no. 6, pp. 1236-1246, 2018. View
at: Publisher Site | PubMed
[22] Majd Zreik, Robbert W van Hamersvelt,
Nadieh Khalili, et al. “Deep learning analysis of coronary arteries in cardiac
CT angiography for detection of patients requiring invasive coronary
angiography.” IEEE Trans Med Imaging, vol. 39, no. 5, pp. 1545-1557,
2020. View at: Publisher
Site | PubMed
[23] Andreas M Fischer, Marwen Eid, Carlo
N De Cecco, et al. “Accuracy of an artificial intelligence deep learning
methodology implementing a recurrent neural network with long short term memory
for the automated detection of calcified plaques from coronary computed
tomography angiography.” J Thorac Imaging, vol. 35, pp. S49-S57, 2020.
View at: Publisher
Site | PubMed
[24] Ran Shadmi, Victoria Mazo, Orna
Bregman-Amitai, et al. “Fully-convolutional deep-learning based system for
coronary calcium score prediction from non-contrast chest CT.” 2018 IEEE
15th International Symposium on Biomedical Imaging, pp. 24-28, 2018.
[25] Majd Zreik, Robbert W van Hamersvelt,
Jelmer M Wolterink, et al. “A recurrent CNN for automatic detection and
classification of coronary artery plaque and stenosis in coronary CT
angiography.” IEEE Trans Med Imaging, vol. 38, no. 7, pp. 1588-1598,
2019. View at: Publisher
Site | PubMed
[26] D B Mark, C L Nelson, R M Califf, et
al. “Continuing evolution of therapy for coronary artery disease: initial
results from the era of coronary angioplasty.” Circulation, vol. 89, no.
5, pp. 2015-2025, 1994. View at: Publisher Site | PubMed
[27] Dan
Milea, Raymond P Najjar, Jiang Zhubo, et al. “Artificial intelligence to detect
papilledema from ocular fundus photographs.” N Engl J Med, vol. 382, no.
18, pp. 1687-1695, 2020. View at: Publisher Site | PubMed
[28] Elijah Bolin, Wilson Lam “A review of
sensitivity, specificity, and likelihood ratios: evaluating the utility of the
electrocardiogram as a screening tool in hypertrophic cardiomyopathy.” Congenit
Heart Dis, vol. 8, no. 5, pp. 406-410, 2013. View at: Publisher Site | PubMed
[29] A G Glaros, R B Kline “Understanding
the accuracy of tests with cutting scores: the sensitivity, specificity, and
predictive value model.” J Clin Psychol, vol. 44, no. 6, pp. 1013-23,
1988. View at: Publisher
Site | PubMed
[30] Rajul Parikh, Annie Mathai, Shefali
Parikh, et al. “Understanding and using sensitivity, specificity and predictive
values.” Indian J Ophthalmol, vol. 56, no. 1, pp. 45-50, 2008. View at: Publisher Site | PubMed
[31] Lucas BD, Kanade T “An iterative
image registration technique with an application to stereo vision. Proceedings
of DARPA Image Understanding Workshop.” pp. 121-130, 1981.
[32] Jinabo Shi, Tomasi C “Good features to track.” 1994 Proceedings of IEEE Conference on Computer Vision and Pattern Recognition, pp.593-600, 1994. View at: Publisher Site
[33] Gunnar Farnebäck “Two-frame motion estimation based on polynomial expansion.” Scandinavian Conference on Image Analysis, pp. 363-370, 2003. View at: Publisher Site